Download
1 / 18
190 likes | 394 Vues
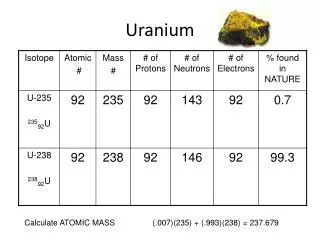
Richard Abitz , Savannah River National Laboratory Bruce Darling , Southwest Groundwater Consulting, LLC. Anthropogenic Induced Redox Disequilibrium in Uranium Ore Zones. GSA 2010, Denver, Colorado. Drilling Issues Related to Redox Disequilibrium Physical change to the ore minerals.

E N D
Richard Abitz, Savannah River National LaboratoryBruce Darling, Southwest Groundwater Consulting, LLC Anthropogenic Induced Redox Disequilibrium in UraniumOre Zones GSA 2010, Denver, Colorado
Drilling Issues Related to Redox Disequilibrium Physical change to the ore minerals
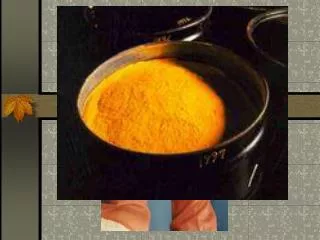
Drilling Issues Related to Redox Disequilibrium Chemical reactions in the ore zone 7/2O2 + H2O + FeS2 → 2H+ + Fe++ + 2SO4-- ½O2 + 2H+ + UO2 → H2O + UO2++ Airlift purge and pump adds O2
Mineral Dissolution Rates General form of rate law (Lasaga, 1995)1: Rate = k0*Amin*e-Ea/RT*anH+*g(I)*Πiani*f(ΔGr) Increase in both surface area (Amin) and O2 activity (anO2) will increase dissolution rate. 1 Lasaga, A.C., 1995, Fundamental Approaches in Describing Mineral Dissolution and Precipitation Reactions, in Reviews in Mineralogy, Volume 31, Chemical Weathering Rates of Silicate Minerals, Mineralogical Society of America.
UEC Permit UR03075 Initial ISL target is B Sand, yellow pattern
Production Test Wells (PTW), Sand B URANIUM: Apr 2008: 0.005 to 0.804 mg/L July 2009: <0.003 to 0.090 mg/L Nov 2009: <0.003 to 0.010 mg/L
Production Test Wells (PTW), Sand B ARSENIC: Apr 2008: 0.001 to 0.022 mg/L July 2009: <0.010 mg/L Nov 2009: <0.010 mg/L
Production Test Wells (PTW), Sand B FUORIDE: Apr 2008: 0.50 to 0.79 mg/L July 2009: 0.50 to 0.54 mg/L Nov 2009: 0.50 to 0.69 mg/L
Production Test Wells (PTW), Sand B RADIUM: Apr 2008: 10 to 1,680 pCi/L July 2009: 17 to 2,000 pCi/L Nov 2009: 10 to 1,590 pCi/L
B Monitor Wells (BMW), Sand B URANIUM: Apr 2008: <0.001 to 0.188 mg/L July 2009: <0.003 to 0.006 mg/L Nov 2009: <0.003 mg/L
B Monitor Wells (BMW), Sand B ARSENIC: Apr 2008: 0.001 to 0.069 mg/L July 2009: <0.010 mg/L Nov 2009: <0.010 mg/L
B Monitor Wells (BMW), Sand B RADIUM: Apr 2008: 0.90 to 41 pCi/L July 2009: 1.3 to 48 pCi/L Nov 2009: 0.10 to 40 pCi/L
Overlying Monitor Wells (OMW), Sand A URANIUM: Apr 2008: 0.006 to 0.014 mg/L July 2009: 0.003 to 0.013 mg/L Nov 2009: 0.009 to 0.012 mg/L
Overlying Monitor Wells (OMW), Sand A ARSENIC: Apr 2008: 0.010 to 0.031 mg/L July 2009: 0.005 to 0.010 mg/L Nov 2009: 0.005 to 0.010 mg/L
Overlying Monitor Wells (OMW), Sand A RADIUM: Apr 2008: 0.5 to 6.0 pCi/L July 2009: 0.2 to 3.2 pCi/L Nov 2009: 0.4 to 1.0 pCi/L