Download
1 / 27
270 likes | 486 Vues
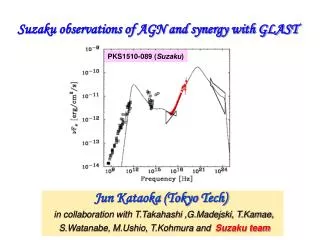
Hard X-ray spectra of AGN observed with Suzaku. --- Time behaviour of AGN ---. Nagoya University Hideyo Kunieda T. Nakamura, Y. Haba and Suzaku team. Suzaku mission. High throughput X-ray telescopes. 4 CCD Cameras (3 FI and 1 BI). HXD (PIN + GSO). ISAS/JAXA. Launched in July 2005.

E N D
Hard X-ray spectra of AGN observed with Suzaku --- Time behaviour of AGN --- Nagoya University Hideyo Kunieda T. Nakamura, Y. Haba and Suzaku team
Suzaku mission High throughput X-ray telescopes 4 CCD Cameras (3 FI and 1 BI) HXD (PIN + GSO) ISAS/JAXA Launched in July 2005
Effective area ofSuzaku detecthion systems GSO PIN XIS (XRT x CCD) 50keV 10keV
BKGD reproduction Night Earth data Fukazawa et al.
Suzaku AGN observations Spectral analysis Broad band spectra (0.2-300 keV) Determination continuum components Emission line and edge structure and then broad iron line profile
Suzaku AGN observations Spectral analysis Broad band spectra (0.2-300 keV) Determination continuum components Emission line and edge structure and then broad iron line profile Timing analysis Difference spectrum = variable component “Difference of time behaviour of various components”
PIN Light Curves of Mkn 3 1 day T. N.
1 N σ2= ----- Σ(xi - μ) 2 Time behavior of PINVariance vs statistical error T. N.
X-ray Spectrum of MCG-5-23-16 XIS PIN Variable power law Scattered Reflection Haba
XIS Light Curves of MCG-5-23-16 Scattered + power law Variable power law T. N.
PIN Light Curves of MCG-5-23-16 Reflection + Power law T. N.
1 Nμ2 σINT2= ----- Σ{(xi - μ) 2 -σi2} Time behaviorExcess Variance of XIS & PIN Excess variance (fractional)
1 Nμ2 σINT2= ----- Σ{(xi - μ) 2 -σi2} Time behaviorExcess Variance of XIS & PIN
Therefore, PDS is given by measured excess variance. PDS(ν1, ν2) = {σ2INT(ν2) - σ2INT(ν1)}/(ν2- ν1) Time behaviorExcess Variance of XIS & PIN The variance is related to the power density spectrum (PDS) as ν1 σ2INT(ν1) = ∫PDS(ν)dν ν0
Smaller scale? Dillution? Time behaviorPower Density Spectra of XIS & PIN
X-ray Spectrum of MCG-5-23-16 XIS PIN Reflection + Power law Variable power law Haba
X-ray Spectrum of MCG-5-23-16 Variable power law Reflection + Power law Reeves et al.
Samples AGN Spectra Watanabe et al