### Statewide Evacuation Model Development for Hurricane Preparedness: Lessons from Hurricane Rita ###
This report details the development of a statewide evacuation model by the Houston-Galveston Area Council in response to the challenges faced during Hurricane Rita in 2005, when over a million people evacuated, resulting in severe congestion and safety issues. The model is designed in phases: initially focusing on the 8-county MPO network and then expanding statewide to better simulate evacuation scenarios, identify bottlenecks, and improve overall planning. Key findings from extensive surveys and trip generation analyses are also presented, highlighting critical insights for future evacuations. ###

### Statewide Evacuation Model Development for Hurricane Preparedness: Lessons from Hurricane Rita ###
E N D
Presentation Transcript
Developing Statewide Evacuation Model Chi Ping Lam, Houston-Galveston Area Council Chris Van Slyke, Houston-Galveston Area Council Heng Wang, Houston-Galveston Area Council
Outlines • Background • Phases for statewide evacuation model • Re-generate Real World Scenario • Detect Network and Demand coding issues through normal daily run • Evacuation results • Sensitivity for Different Evacuaton Scenarios • Next Steps
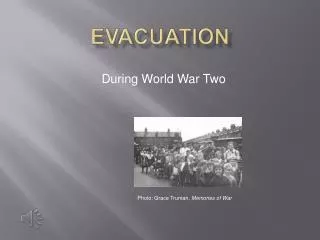
Motivation • In September 2005, Hurricane Rita landed east of Houston • Over 1 million people attempted to evacuate from the eight county region • Severe congestion as a results
Retreat! • Evacuation routes became “parking lots”. • Some people spent more than 18 hours on the evacuation routes • Fatal accidents, abandoned cars, and other safety issues
In response… • H-GAC coordinated with various governmental agencies to develop a hurricane evacuation plan. • H-GAC was asked to develop a tool for evacuation planning – an evacuation model
Phases • Phase 1: Develop evacuation model on our 8-county MPO network • To model how well the transportation system could move evacuee outside our region • 90% completed • Phase 2: Expand to statewide network • Model impacts from outside the MPO region • Provide a more complete evacuation experience • Early stage
Limitation on Phase 1 Model • Around 90% of Rita evacuation trips travel outside of MPO region. The queues extended far away our region. • The external stations are treated as “destinations” in phase 1 trip distribution. Those external stations are not real destination. • Some known bottlenecks are outside the MPO network, and the traffic queued back to the MPO network. The Phase 1 model could not model the effect of the bottlenecks well. • Some evacuation policies, like contraflow lanes, extend to and impact area outside the MPO networks. Phase 1 model could not model their full impact
Outside Region Inside Region
Goals of Phase 2 Model • Generate a complete evacuation trip tables • Model impact of bottlenecks outside the MPO region • Model policies outside the MPO region • Measures congestion outside the MPO region • Provide a complete picture of evacuation experience, such as total travel time
Phase Two Processes • Get a copy of statewide model (in TransCAD) • Convert the trip tables and the network from TransCAD format to Cube Voyager format • Merge the statewide and regional networks and trip tables • Manually coding the missing bottleneck • Develop statewide evacuation trip tables • Test Run • Model Performance Improvement • Calibration and Validation
Houston TranStar Rita Evacuation Survey • Solicited participation on website • Participants responded to questions online • 6,570 respondents • 6,286 usable household responses • 3,886 households evacuated by car or truck
Phase 1 Evacuation Trip Tables • Six-day event modeled • Cross-classification variables: • 6 geographical districts • 5 household size groups • Production models: • Probability of evacuating • Vehicle trips/evacuation household • Trip purpose split • Simple attraction models • Non-resident trip models
Six Districts • Districts 1-3 are the three mandatory evacuation districts • Districts 4-6 are other part of the MPO regions, defined by its distance to the coastline
External Station Evacuation Attractions • Distributed attractions to other urban areas based on their population and relative accessibility • Allocated results to external stations
Distribution Model For External Station Attractions • Similar to traditional external-local models using a gravity model • Primary difference is that the external stations are treated the attractions • Somewhat relaxed version of the normal external-local friction factors used
From Region-wide to state-wide trip tables • Obviously, the external stations of the MPO network are not true destinations but rather a “gate” to outside MPO destinations. • Trip generation and distributions should use real destinations • First task is to geo-coding the survey to statewide level
Geo-coding the OD • 4,092 records are inputted for geo-coding • ArcGIS automatically geo-code the destinations if the destinations are cities inside Texas. • Most coding errors are mis-spelling which could be corrected • Only 0.4% of records are without sufficient information to identify the destinations
Where are people going to? Top 10 Destinations (by Transtar Survey) Austin 9.7% Dallas 7.9% San Antonio 7.1% Houston 5.3% Louisiana 2.8% College Station 2.4% Conroe 1.6% Fort Worth 1.6% Waco 1.6% Livingston 1.5% Hundreds of other destinations!!
Summary of Survey Findings • Hundreds of destinations! • 91.5% evacuation trips are in-state • 16.9% evacuee change their destinations • Most evacuee visit their friends or families • Austin, Dallas, and San Antonio, the three largest adjacent metropolitan area, are the top three destinations • Other major destinations concentrated on US-59, I-45, and I-34 corridors. • 82% of planned in-state evacuation trips are within 4.5 hours (free flow time) from Houston
Factors of Determining Attractions • Population is the most dominant factor • Over 80% of evacuees visit family or friends • Hotel and Shelters • Coastal area are not very popular • Evacuated or closed • There is strong evidence that most evacuees disfavor long trips
Survey Trips normalized by county population Big cities are not necessary most attractive other than number of people Hill countries are somehow very attractive A few outliners
Develop Trip Production Model for Rita Scenario • Our model will re-generate the Rita scenarios • For trip produced inside our MPO region, use the same production model from Phase 1 model • Use the same trip table of Phase 1 model for internal-internal trips. • Very few information regarding trip produced outside our MPO region.
Develop Trip Attractions for Rita Scenario • The considered factors: • Population • Accessibility or Distance • Distance from the coast or coastal area indicator • Potential bias factor • Initial analysis suggests linear regression model is not a good fit as population rules over other factors • Trip normalized by population may be a better variable than population
Statewide Network • Import Texas Statewide Model (SAM) Network • Include air, marine, freight rails • Less roadway details inside our MPO region than our MPO network • Adequate for modeling major traffic flow • Does not support every details in bottleneck, like ramps in direct interchange or traffic light in a small town • Have to add some details to the statewide network
Merging Statewide and MPO Networks • The statewide network does not provide enough access points or local road capacity to load evacuation traffic to evacuation routes inside Houston metropolitan area • For Mesoscopic assignment, this could mean evacuation traffic get stuck in local streets, execrates local congestion while underestimates congestion on evacuation routes. Trial run of using a simplified network in Phase 1 model supports this logic. • Therefore, MPO network is required to load the evacuation traffic • Only auto links are merged. All non-auto links are deleted.
Handle Inconsistencies between the two networks • The external stations of the regional model connects to the statewide network very well (only 1 or 2 minor stations without a match) • The Statewide model and region model have different number and definitions of facility types and area types • Therefore, for the same road inside MPO region, its capacities for the statewide model and regional model are different • Use regional model setting inside MPO region
Bottleneck at US 290 @ US-36 • Major bottleneck outside MPO region • Cause by 1 lane direct interchange not coded in the statewide network
Other network Modifications • Adding Contraflow lanes in the network • May put toll identification to the network
Slow Test Run • Perform a test run using regular trip tables only • The mesoscopic assignment complete, and only take 96 hours to complete! • Need to reduce running time for more efficient calibration and validation process
Option1:Aggregate Zone System • SAM models has 4800 TAZ • Aggregate zone. The aggregated zones cross county boundary (zone is always within one county) • The number of zone could be reduced to between 1000-1500 zones. • Reduce path-building time • Avoid assign short trips as those trips are now intra-zonal trips • This should reduced the running time to less than 2 days
Option 2: Sub-area • Based on the survey, most of the evacuee did not travel west of the Hill Country area • West Texas and the Pan-handle areas could be removed from the model • Affected cities includes El Paso, Amarillo, Midland, Lubbock
Option 3: Reduce Regular-Day Traffic • One goal of model is to measure how evacuation traffic impacts regular traffic flow in destinations • The static statewide model shows serious congestion inside metropolitan area, maybe because lacks of details • Perhaps reduce regular day traffic inside urban area to compensate lacks of roads
Summary • The statewide evacuation model is the next phase of regional evacuation model. • Provide more complete pictures of evacuation experience and the impact of evacuation strategies. • Need to develop evacuation trip attraction model • Need to add crucial details to the statewide network • Need to reduce running time