Download
1 / 11
Understanding Daily Changes in Share Prices: Analyzing NH Polls & Normal Density Functions
110 likes | 216 Vues
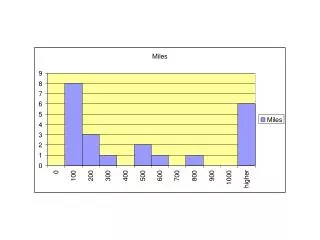
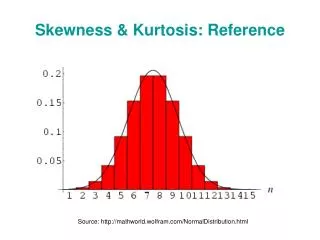
Explore how colleges use data desks to create histograms of daily changes in share prices, understanding errors and distribution shapes like unimodal, bimodal, or multimodal. Learn about symmetrical versus skewed distributions.
Télécharger la présentation 
Understanding Daily Changes in Share Prices: Analyzing NH Polls & Normal Density Functions
An Image/Link below is provided (as is) to download presentation
Download Policy: Content on the Website is provided to you AS IS for your information and personal use and may not be sold / licensed / shared on other websites without getting consent from its author.
Content is provided to you AS IS for your information and personal use only.
Download presentation by click this link.
While downloading, if for some reason you are not able to download a presentation, the publisher may have deleted the file from their server.
During download, if you can't get a presentation, the file might be deleted by the publisher.
E N D
Presentation Transcript
Shape of a distribution… Outliers Unimodal --- Bimodal --- Multimodal Symmetrical Skew - right or left?


More Related