Astrophysics for Mathematicians
140 likes | 165 Vues
Delve into the world of astrophysics, understand the distinction between source and background in astronomy, explore deep field observations, crowded field challenges, and cosmological concepts. Learn about biases in astronomy, quasars, censored statistics, binary stars, and orbital predictions.

Astrophysics for Mathematicians
E N D
Presentation Transcript
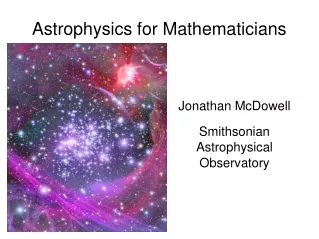
Jonathan McDowell Smithsonian Astrophysical Observatory Astrophysics for Mathematicians
Source and Background • Key concept in astronomy: distinction between source and background • Like signal and noise, but... sometimes the background is interesting ('signal') in itself
Deep Field Faintest sources have only a few photons (get 1 per 4 days per source) Background from sky (varies with position slowly; varies with energy) and from detector (varies with time and position) - both source and backgrounds are Poisson Is this a source or a background fluctuation? What are the confidence intervals on the number of photons from this source? I know there is a star here; what is the upper limit on its flux?
Crowded Field Problem here is overlapping sources and extended emission What is the error on the individual fluxes of source 1 and source 2 when they both overlap with source 3? What is the total flux of the diffuse purple stuff, ignoring the stars on top of it? What are the fluxes of the stars? How does my confidence in the reality (i.e. flux >0) of a source change if it's on this varying background? How can I automatically detect linear features like this? (Scene parsing problem)
Cosmology: The Hubble Redshift Spectral lines give fingerprint of compositio, temperature, etc. Hubble's Law: more distant objects are shifted to the red - 'redshift', expanding universe - How do you separate continuum from lines? Model-dependent Measure peak in presence of noise Measure integral under curve in presence of noise and model assumptions
Cosmology: Thinking Big Map galaxies out to 500 million light years Real velocities (e.g. clusters) superimposed on Hubble flow: distorts radial coordinate Distance is NOT EUCLIDEAN! Volume sampled is no longer 4/3 pi r cubed due to curved space-time Want to derive population properties - brightness, size, etc - as function of distance (therefore, cosmic time) But - biases in sample
Biases Eddington Bias: in astronomy, there are always more little faint things than big bright things. This is true for asteroids, stars, galaxies, .... Suppose there are 10 stars of mass 0.5 and 100 stars of mass 0.4, and you have a 20 percent error on measuring the mass. Then you'll put 2 of the 10 big stars in the smaller 0.4 bin, and you'll put 20 of the 100 small stars in the bigger 0.5 bin, ending up with a measurement of 28 for mass 0.5 and 82 for mass 0.4 - a big problem especially if you truncate your dataset at 0.5. This is Eddington bias. NUMBER OF STARS VS MASS HOW BIG --->
Biases Malmquist Bias: Distant objects are fainter Your telescope can't see the faintest objects Comparing subsamples of near and far objects, you get a different distribution of true luminosities
Quasars: V/Vmax Suppose you observe 1000 quasars with different brightnesses but you don't know their true distances. Each observation has a different limiting brightness. Define Smin is the faintest that a given quasar could have been for you to still have seen it. If its actual brightness is S, then if the inverse square law and Euclidean geometry apply V/Vmax = (S/Smin)**(-1.5) where Vmax is the volume the quasar could have been in and you would still have seen it. If the population is uniformly distributed in space, you expect <V/Vmax> for the population to be 0.5; typically half the objects will be in the inner half of the volume and half will be in the outer half. If the answer turns out to be not 0.5, then your population is evolving... You can do the same thing evenwhen the geometry isn't Euclidean (exercise :-))
Censored statistics These are energy distributions (brightness versus wavelength) of quasars. What is the best estimate of the total brightness of each object? (join the dots) What is the best estimate of the typical energy distribution of the population? You need to take the upper limits into account. (e.g. using the Kaplan-Meier bound) What are the differences between the objects? (PCA)
Binary stars IM Peg: little yellow star like our Sun, plus big red star with strong magnetic field
Light Curves - Nice and Nasty Poor sampling; gaps on similar timescale to periodic components Search for periodicities and quasi-periodicities in the presence of noise and complicated window (gap) functions
We're all going to die Is this rock going to hit the Earth? Can we reliably propagate the orbit 20 years in the future and understand the errors? “There is a 1 in 200 chance that this will hit the Earth in 2028..' - but next week's data point reduces the chance to zero. Can we give the public a better way of expressing the risk than this simple minded conditional probability?