Comparative Results of Cognitive Function in Schizophrenia Patients
Explore the accuracy and reaction time of SZ age groups compared with healthy controls in tasks of varying difficulty. Visual data analysis with significant differences highlighted in red.

Comparative Results of Cognitive Function in Schizophrenia Patients
E N D
Presentation Transcript
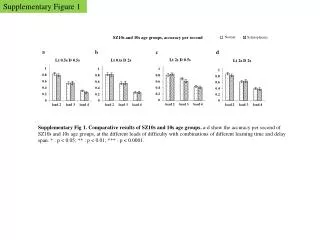
Supplementary Figure 1 SZ10s and 10s age groups, accuracy per second a b c d Normal Schizophrenia Supplementary Fig 1. Comparative results of SZ10s and 10s age groups. a-d show the accuracy per second of SZ10s and 10s age groups, at the different loads of difficulty with combinations of different learning time and delay span. * : p < 0.05; ** : p < 0.01; *** : p < 0.0001.
Supplementary Figure 2 SZ30s and 30s age groups, accuracy per second d b c a *** *** *** *** ** ** ** * ** ** ** * Normal Schizophrenia Supplementary Fig 2. Comparative results of SZ30s and 30s age groups. a-d show the accuracy per second of SZ30s and 30s age groups, at the different loads of difficulty with combinations of different learning time and delay span. * : p < 0.05; ** : p < 0.01; *** : p < 0.0001.
Supplementary Table 1 Supplementary Table 1, Accuracy per second, various groups. Red indicates significant difference.
Supplementary Table 2 Supplementary Table 2, Comparison between schizophrenia and control groups, p value. Red indicates significant difference.
Supplementary Figure 3 a b c Supplementary Fig 3. The historical Chinese jiugongtu“九宫图”. (a), The jiugongtumap is a Chinese historical artifact developed several centuries before 0 BCE, perhaps first described in I Jing [25,37] . It presents a grid-like arrangement of number-marks. The substitution of numbers for the number of marks (b), shows that the numbers from 1 to 9 are arranged so as to add up to 15 in whatever dimension we proceed to calculate. This magic square is well-known in Chinese culture, making it a friendly and understandable spatial map for subjects. (c), The SWAPS test uses the nine-spaced grid as a background, but fills it with paired symbols.
Supplementary Figure 4 Correct choice, control (%) load 2 load 3 load 4 a b c d f g h e Correct choice, schizophrenia (%) Supplementary Fig 4. Comparison of schizophrenic and healthy groups. SWAPS showed the highest percentage of correct choices in the age 20-27 (group 20s) healthy control group but not in schizophrenia patients ages 20-29 (group SZ20s).a-d show the percentage of correct choices in 5 healthy control age groups (10s, 20s, 30s, 40s, 50s), at different difficulty loads and with different combinations of learning time and delay span. (e-h) show the percentage of correct choices for 3 age groups in schizophrenia patients (SZ10s, SZ20s, SZ30s), under the same learning time and delay span conditions as the healthy control groups. Lt, learning time (0.5sec or 2sec); D, delay span (0.5sec or 2 sec).
Supplementary Figure 5 Reaction time, control groups (ms) load 2 load 3 load 4 a b c d e g f h Reaction time, schizophrenia groups (ms) Supplementary Fig 5. Healthy control and schizophrenia groups, showing reaction time. a-d shows the reaction time of 5 healthy control age groups, at different loads of difficulty with different combinations of learning time Lt and delay span D. e-f show the reaction time of 3 age groups in schizophrenia patients, matching the control group’s Ltand D conditions. Lt :Learning time; D: Delay span, error bar shows standard error.
Supplementary Figure 6 Comparison of SZ10s and 10s, correct choices (%) b c d a g h e f Schizophrenia Normal Comparison of SZ10s and 10s, reaction time Supplementary Fig 6. Comparative results of SZ10s and 10s age groups. Percentage of correct choice is shown in a, b, c, d and reaction time is shown in e, f, g, h. *p < 0.05; **p < 0.01; ***p < 0.0001; error bar shows standard error.
Supplementary Figure 7 SZ20s and 20s age groups, correct choice (%) a d c b * * * *** *** * *** ** ** ** Normal Schizophrenia f g h e * * * * * * *** * * SZ20s and 20s age groups, reaction time (ms) Supplementary Fig 7. Comparative results of SZ20s and 20s age groups. a-d show the percentage of correct choices of SZ20s and 20s age groups, at the different loads of difficulty with the combination of different learning time and delay span. e-h show the reaction time of SZ20s and 20s age groups, at different loads of difficulty with combinations of different learning time and delay span. * : p < 0.05; ** : p < 0.01; *** : p < 0.0001.
Supplementary Figure 8 Comparison of SZ30s and 30s, correct choices (%) a b c d * * * * * * * Schizophrenia Normal e f g h ** ** *** ** *** *** ** *** *** * *** Comparison of SZ30s and 30s, reaction time Supplementary Fig 8. Comparative results of SZ30s and 30s age groups. Percentage of correct choice is shown in a, b, c, d and reaction time is shown in e, f, g, h. *p < 0.05; **p< 0.01; ***p< 0.0001; error bar shows standard error.
Supplementary Figure 9 c b a * *** * *** ** *** ** *** *** Supplementary Fig 9. Various learning times, and delay spans for test design. In designing the test, we examined various learning times, and delay spans for health people group ages 18-24. The first versions of the test needed to determine the most appropriate Lt and D to show differentiation between loads. Fig. 5a shows the variation of correct responses through difficulty loads two, three and four, presenting evidence that the design of the test can discriminate between difficulty loads. We found that D of up to 2 seconds had the same results as D of up to 5 seconds (Fig. 5b). The added time did not increase accuracy in responses, and so we shortened D in our test design to 2 seconds. We found that Lt shows the largest differences between loads when Lt has a value of between 0 and 2 seconds, and when Lt exceeds 2 seconds the test results for all loads of difficulty begin to converge toward higher percentage of correct response (Fig. 5c). Lt :Learning time; D: Delay span. error bar shows standard error.
Supplementary Table 3 Supplementary Table 1, Correct choice (%), various groups. Red indicates significant difference.
Supplementary Table 4 Supplementary Table 4, Reaction time, various groups. Red indicates significant difference.
Supplementary Table 5 Supplementary Table 5, Comparison between schizophrenia and control groups, p value. Red indicates significant difference.
Supplementary Table 6 Supplementary Table 6, demographic information of patients and their counterparts.
Supplementary Table 7 Supplementary Table 7, Comparison between male and female of all the tested age group, p value. Red indicates significant difference.