Download
1 / 39
390 likes | 461 Vues
Explore the identification of UTLS, Asian and fire influence on O3 in air quality data. Discover the concept of Policy Relevant Background (PRB) in setting ozone standards with observations from monitoring sites and exceptional O3 events. Learn about verification challenges, high-O3 days, and workshop findings.

E N D
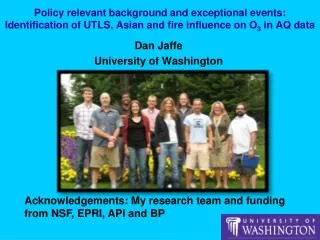
Policy relevant background and exceptional events: Identification of UTLS, Asian and fire influence on O3in AQ data Dan Jaffe University of Washington Acknowledgements: My research team and funding from NSF, EPRI, API and BP
Ozone standard getting tougher • As NAAQS gets closer to background, we need a better understanding of O3 sources including what can and cannot be controlled; • “Policy Relevant Background (PRB)” and “Exceptional events” are two terms used by EPA in this context.
Policy Relevant Background • “…is defined as the distributionof ozone concentrations that would be observed in the U.S. in the absence of anthropogenic emissions of preccusor emissions in the U.S., Canada and Mexico.” [OAQPS Staff paper, July 2007]. • Essentially PRB is the lowest O3you could get if you shut off all anthropogenic emissions in the US, Canada and Mexico. • This recognizes that PRB is a distribution, not one value; • PRB is essential to set the standard and for estimates of risk. • For 2008 O3 review, EPA relied on PRB calculated by Fiore et al (2003), which used the GEOS-Chem global model. • But since PRB is a model derived quantity, how can we verify the values, especially at the high end of the distribution, where models are more challenged?
Trinidad Head O3 profiles: 1997-2009 data from NOAA Ozonesonde Photo and data from NOAA-ESRL • O3 is only regulated pollutant with a positive gradient in height and where background mixing ratios are close to AQ standard. • For spring and summer, 95th percentile at 2 km is 71 ppbv. • Two issues with sondes: Under-sampling and no supporting chemical data.
Average MDA8 at Rocky Mtn CASTNET sites • Average MDA8 at these sites significantly correlated with elevation. • While there are site to site differences, interannual variations are significantly correlated across these sites with exception of Big Bendsite. (Jaffe 2010).
Observations at Mt. Bachelor (2.8 km asl) • Observations of O3, CO, aerosols, Hg, NOx, PAN, etc started in 2004 by the U of Washington in cooperation with the Mt Bachelor ski area. • Observations to characterize FT air, NOx, PAN, Hg etc etc. • Over past 7 years, we have observed 25 days with an MDA8 g.t. 70 ppbv. Most of these events are found in dry, subsiding air. • What is the cause for these high O3 days?
High O3 events at Mt. BachelorUT/LS: April 22, 2006 Asian LRT: May 12, 2008 Source for each air mass was confirmed using multiple techniques. (Jaffe et al 2005; Weiss-Penzias et al 2006; NAS 2009; Ambrose et al 2011).
Classification of high O3 days at MBO: 2004-2009 data We identified 25 days with MDA8 greater than 70 ppbv, of these we were able to classify 18 days. (Ambrose et al 2011).
Variability in Free Tropospheric/Background O3Average summer vertical profiles from Trinidad Head Causes are interannualvariablity in tranpsort, S-T exchance, fires, dust source, etc Price et al 2004 (ozone); Fischer et al 2009 (dust); Reidmiller et al 2009 (CO)
Number of days per year greater than exceedance threshold for 3 sites near Seattle Do variations in PRB contribute to variations in surface exceedance days?
PRB workshop at UT-Austin, March 2011 • David Allen, The University of Texas at Austin • Nancy Brown, Lawrence-Berkeley Laboratory • Daniel Jacob, Harvard University • Daniel Jaffe, University of Washington • Charles Kolb, Aerodyne Research, Inc. • Allen Lefohn, A.S.L. & Associates • Elena McDonald-Buller, The Univ. of Texas at Austin • Samuel Oltmans, NOAA • David Parrish, NOAA • Gregory Yarwood, ENVIRON Workshop findings to be published in Atmos. Environment
Key findings from PRB workshop • PRB ozone concentrations vary spatially and temporally across the United States. PRB can also vary inter-annually; • Quantification of PRB ozone requires both global chemical transport models and measurements from relatively remote sites; • Agreement between measurements and global model predictions of the monthly mean of the MDA8 ozone at remote sites provides some confidence in the ability of global chemical transport models to predict PRB ozone in many parts of the U.S. • Global chemical transport models are less successful in predicting monthly mean MDA8 ozone values in some regions of the U.S., including the Gulf Coast, regions affected by fires, and in complex topography, which have implications for model estimates of PRB O3.
Simulations of ozone in western US (2006) with GEOS-Chem at 0.5o x 0.67o resolution Monthly means ± σ Model sampled on observation days MDA8 ozone Mt. Bachelor Observatory (122W, 44N, 2.7km) Trinidad Head (124W, 41N) GEOS-Chem Observed Trinidad Head (124.2W, 41N,107m) MDA8 ozone Boulder (105W, 40N) • Work of Harvard group: Zhang and Jacob (2011)
Spatial and temporal variations in PRB • Spring (March-May) Summer (June-Aug) • Average MDA8 from GEOS-Chem due to PRB (Zhang and Jacob (2011)) • Note strong influence from elevation as reported from observations at: • Trinidad Head (Oltmans et al 2008) • Western US (Jaffe 2011) • Mt. Bachelor (Ambrose et al 2011)
Annual 4th highest MDA8 due to PRB sources from GEOS Chem (Zhang and Jacob (2011) GEOS-CHEM suggests that high elevation sites will have great difficult meeting a 60-70 ppbv standard due to PRB (uncontrollable) sources. This is consistent with observations from Mt. Bachelor and CASTNET sites in the Western US (Jaffe 2010; Ambrose et al 2011).
MDA8 values for 2006 for Gothic Colo. from GEOS-Chem and CASTNET observations Black = Obs Red = GC-std Blue = GC-Linoz • Highest MDA8 values for the year were on April 19-20th, 83 and 88 ppbv, respectively. The Hysplit trajectories (right) and very low observed water vapor mixing ratios for these days suggests a UTLS source. • Some high episodes are not accurately captured in GEOS-Chem.
Role of fires • All fires produce O3 precursors, but emissions and photochemistry vary a lot. Some fires appear to produce little O3 while others produce a lot (Jaffe and Widger 2011); • Good correlation between burned area and O3 for western US (Jaffe 2008; 2011). • Fires appear to explain a significant fraction of the large inter-annual variability in MDA8 at many sites in the Western US.
Average number of exceedance days per site per year at various threseholds The interannual variations are significantly correlated correlated across all sites, which suggests large scale (PRB) variations. What controls these interannual variations?
Summer average MDA8 and exceedance days for 10 CASTNET sites in the Western US. Wildfire NOx emissions from GFED2 database. Wildfire NOx, exceedance days and MDA8
Exceptional events • “Unusual or natural events that affect air quality but are not reasonably controlled…” • For O3, could include UTLS events, wildfires or long-distance, international pollution; • State agency must show that the air quality would have met the standard "but for” the unusual event. • If EPA concurs, these data can be excluded in calculation of design value; • Examples given at URL below, demonstrate cases due to wildfires and July 4th fireworks (!). Fireworks events were accepted as EE by EPA. See http://www.epa.gov/ttn/analysis/exevents.htm for examples and detailed discussion.
Exceptional Events (EE) • EE rule appears to be most useful for sites that are close to meeting AQ standard; • “In general, the type, amount, and detail of evidence will vary by the circumstances for each event.” (Neil Frank, OAQPS/EPA); • “The more extreme the measured concentration, the less evidence would generally be needed to justify that the concentration was exceptional.” (Neil Frank, OAQPS/EPA) • Demonstration of an EE for O3 will likely require greater evidence due to its greater complexities.
Types of evidence • General description of event: e.g. type, size, location, duration, estimated emissions, press accounts, photos, etc; • Comparisons to long-term data; • Comparisons to nearby monitors. • Diurnal patterns of concentrations; • Satellite data products; • AQ modeling; • Weather and/or trajectory data; • Chemical fingerprinting methods; • Statistical models to characterize past AQ exceedance days • Any other reliable or accurate data.
EPA technical evaluation of EE • Clear causal relationship; • Concentrations in excess of normal historic values; • No exceedance “but for” the event.
Only one EE for O3 listed at EPA website • CARB requested EE designation for 1 hr O3 for Folsom, CA for 3 days in June-July 2008 based on contribution from extensive Calif wildfires burning at that time. • Folsom part of Sacramento Metropolitan NAA (1 hr O3), which Calif wants to re-designate to attainment. • CARB submitted several hundred pages of documentation including monitoring data, meteorological data, satellite data, photos, trajectories, etc. • Key component was statistical model to demonstrate what O3 would have been “but for” the event.
CARB statistical model for 1 hr O3 for Sacramento NAA Daily peak O3= fn (cloudiness, WS, WD, P, Dew pt, Aloft temp, Aloft WS, Surface-aloft ΔT) • Developed using data from 1997-2003 data; • 1 sigma error of ~15 ppbv. • Re-evaluated with 2007 data and found to give positive bias of 8-13 ppbv, presumably due to recent emission reductions. • CARB used the bias corrected model to estimate a wildfire contribution of 40-80 ppbv to the observed values of 120-160 ppbv. This satisfied the “but for” clause for the 3 days considered.
High O3 at surface sites in Rocky Mtns, April 2006 Black = Obs Red = GC-std Blue = GC-Linoz • Highest MDA8 values for the year at Gothic Colo. were on April 19-20th, 83 and 88 ppbv, respectively. The Hysplit trajectories (right) and very low observed water vapor mixing ratios for these days suggests a free tropospheric source. • Between 4/19-4/21 four different sites had MDA8>70 ppbv. (Canyonlands, Great Basic, Yellowstone, Mesa Verde and Rocky Mtn. All appear to have similar characteristics. • Since CASTNET has no precurrsor measurements, • unclear if this was due to UTLS or Asian air pollution. • Likely candidate for EE exclusion.
Enumclaw Exceedance Days, August 2010 Two days with MDA8 values greater than 70 ppbv. But note elevated PM and reports of extensive haze throughout Puget Sound region. Thanks to Puget Sound CAA for the air graphing tools!
Media reports • KIRO TV: “Hazes skies creating spectacular sunsets in western Washington” (due to BC wildfires, 8/2/2010); • Wash Dept of Ecology news release on haze from BC fires (8/16/2010); • But note this alternate explanation: Seattle Hempfest August 19-21, 2010. From KIRO news website, 8/2/2010
NOAA HMS Fire and Smoke ProductsAugust 17, 2010 • While the Enumclaw MDA8s were not that exceptional (77 and 73 pppv), smoke from BC was clearly present; • Complex case as smoke traveled thru Vancouver, Everett-Seattle region; • Unclear to what extent BC fires contributedto MDA8.
Observed and modeled (GEOS-Chem) CO,O3 and aerosols from Siberian fires June 2003 Measured vertical profile near Wash coast (Bertschi et al 2005). Modeled CO with GEOS-Chem Jaffe et al 2004
Evaluation of Siberian wildfire contribution to Enumclaw MDA8 based on MDA8-temp relationship Enumclaw MDA8 for 1996-2003 vs daily max temp. Red points were associated with long range transport from Siberian wildfires that occurred in June 2003. See Jaffe et al (2004) for details.
Possible approaches to consider for exceptional event designations • Sites with multiple tracers (e.g. CO, O3, NOx, PM2.5, VOCs, etc) will facilitate improved understanding of O3 sources; • Multi-variable statistical model to predict “usual” O3 as a function of temp, winds, RH at surface and/or aloft and other tracers; • Principal component analysis to quantify components associated with different O3 sources (work in progress for western US); • HYSPLIT and/or FLEXPART modeling to identify O3 sources (work in progress).
Conclusions • As NAAQS is lowered, understanding PRB and exceptional events is essential to understand degree to which O3 can be controlled; • The goal should not be to get a region “off the hook” for pollution sources that can be controlled, but to hold them harmless for those sources that can not be controlled; • High O3 days in the lower FT (2-3 km) occur due to UT/LS events and/or Asian long-range transport events (Ambrose et al 2011). Occasionally these plumes intercept the surface and contribute to high MDA8 values. • Observations and models indicate that elevated sites (>2km) in the west and NW are exposed to high O3from Asiaand UTLS (Jaffe 2010). Many sites above 2 km will likely not meet NAAQS at 70 ppbv or below due to PRB. • Wildfires can make substantial contributions to MDA8. Identifying an influence from wildfire on PM is not difficult, but quantifying the influence on O3 requires greater evidence and a statistical model; • Multivariate data analysis methods show promise to identify the causes for high O3daysand will support exceptional event designations. Sites with multiple observations provide much richer database to understand sources. • We collect a lot of data, but don’t spend enough time analyzing it. Let the data speak!
Seasonal variations at Rocky Mtnsites Monthly pattern of average MDA8 Avg number of exceedance days per month at 3 thresholds, 65,70 and 75 ppbv.
Gothic, CO, April 20 2006, GMT hour 16 Peak hourly O3 = 94 ppbv • Trajectories indicate transport from 400-500 hPa (5-6 km elevation) over previous 72 hours. • Use trajectories to quantitatively characterize transport on each day. • For subsidence, incorporate “Min Pressure” from trajectory analysis into PCA.
O3 at Mt. Bachelor Max daily 8 hravg O3 at Mt. Bachelor for 2007-2009