Download
1 / 5
50 likes | 57 Vues
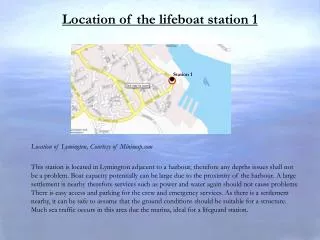
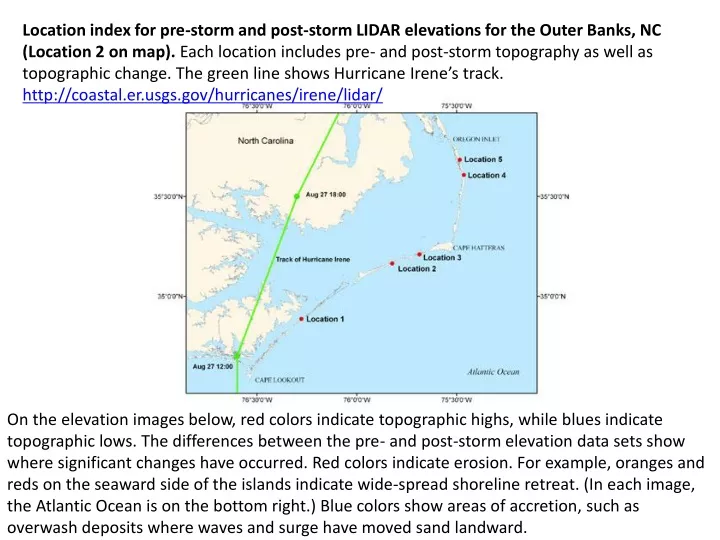
Location index for pre-storm and post-storm LIDAR elevations for the Outer Banks, NC (Location 2 on map). Each location includes pre- and post-storm topography as well as topographic change. The green line shows Hurricane Irene ’ s track. http://coastal.er.usgs.gov/hurricanes/irene/lidar/.

E N D
Location index for pre-storm and post-storm LIDAR elevations for the Outer Banks, NC (Location 2 on map). Each location includes pre- and post-storm topography as well as topographic change. The green line shows Hurricane Irene’s track. http://coastal.er.usgs.gov/hurricanes/irene/lidar/ On the elevation images below, red colors indicate topographic highs, while blues indicate topographic lows. The differences between the pre- and post-storm elevation data sets show where significant changes have occurred. Red colors indicate erosion. For example, oranges and reds on the seaward side of the islands indicate wide-spread shoreline retreat. (In each image, the Atlantic Ocean is on the bottom right.) Blue colors show areas of accretion, such as overwash deposits where waves and surge have moved sand landward.
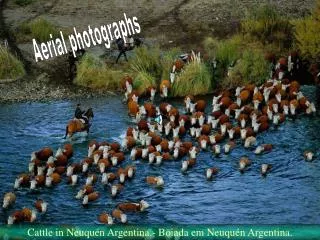
Location 2, Pre- and Post Storm Ocracoke Island, NC, Aerial Photographs, courtesy of the USGS http://coastal.er.usgs.gov/hurricanes/irene/photo-comparisons/ http://coastal.er.usgs.gov/hurricanes/irene/photo-comparisons/
November 27-December 1, 2009 (pre-storm) Ocracoke Island, NC RED = HIGH, BLUE = LOW http://coastal.er.usgs.gov/hurricanes/irene/photo-comparisons/
August 28-29, 2011 (post-storm) for a portion of Ocracoke Island, NC RED = HIGH, BLUE = LOW http://coastal.er.usgs.gov/hurricanes/irene/photo-comparisons/
Topographic change (difference) for a portion of Ocracoke Island, NC RED = EROSION, BLUE = ACCRETION http://coastal.er.usgs.gov/hurricanes/irene/photo-comparisons/