Download
1 / 17
170 likes | 260 Vues
Learn how to find the area between two curves, consumer surplus, and producer surplus using calculus methods. Explore step-by-step examples and calculations for equilibrium points, consumer and producer surpluses. Understand how to determine where graphs intersect, compute integrals, and more.

E N D
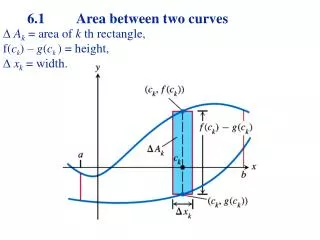
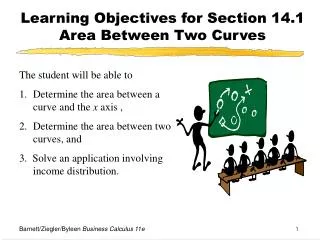
7.5Area Between Two Curves Find Area Between 2 Curves Find Consumer Surplus Find Producer Surplus
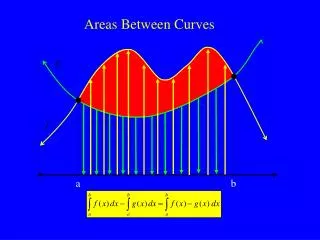
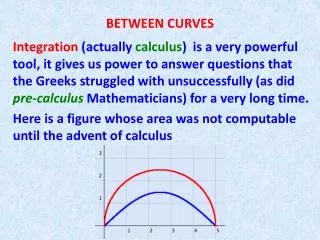
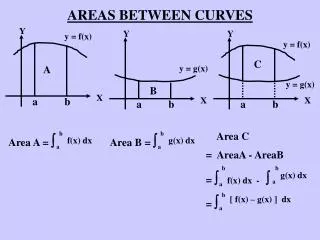
Area between 2 curves Let f and g be continuous functions and suppose that f (x) ≥ g (x) over the interval [a, b]. Then the area of the region between the two curves, from x = a to x = b, is
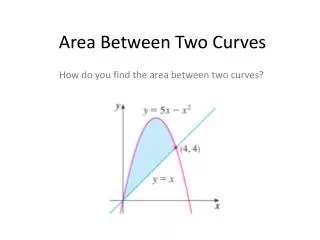
Example: Find the area of the region that is bounded by the graphs of First, look at the graph of these two functions. Determine where they intersect. (endpoints not given)
Example (continued): Second, find the points of intersection by setting f (x) = g(x) and solving.
2 2 ò ò é ù + - + = - 2 2 ( 2 1 ) ( 1 ) ( 2 ) x x d x x x d x ë û 0 0 2 é ù 3 x = - 2 x ê ú 3 ë û 0 æ ö æ ö 3 3 2 0 = - - - 2 2 2 0 ç ÷ ç ÷ è ø è ø 3 3 8 4 = - - + = 4 0 0 3 3 Example (concluded): Lastly, compute the integral. Note that on [0, 2], f (x) is the upper graph.
DEFINITION: The equilibrium point, (xE, pE),is the point at which the supply and demand curves intersect. It is that point at which sellers and buyers come together and purchases and sales actually occur.
DEFINITION: Suppose that p = D(x) describes the demand function for a commodity. Then, the consumer surplus is defined for the point (Q, P) as
C o n s u m e r x ( ) ò = E D x d x x p - × E E S u r p l u s 0 3 ò = × 2 ( 5 ) 3 4 x d x - - 0 3 ò = 2 - ( 1 0 2 5 ) 1 2 x x d x + - 0 Example: Find the consumer surplus for the demand function given by When x = 3, we have Then,
DEFINITION: Suppose that p = S(x) is the supply function for a commodity. Then, the producer surplus is defined for the point (Q, P) as
P r o d u c e r x ò ( ) E x p S x d x = × - E E S u r p l u s 0 3 ò × - 2 3 1 5 ( 3 ) x x d x = + + 0 Example : Find the producer surplus for Find y when x is 3. When x = 3, Then,
Example: Given find each of the following: a) The equilibrium point. b) The consumer surplus at the equilibrium point. c) The producer surplus at the equilibrium point.
Example (continued): a) To find the equilibrium point, set D(x) = S(x) and solve. Thus, xE = 2. To find pE, substitute xE into either D(x) or S(x) and solve.
Example (continued): If we choose D(x), we have Thus, the equilibrium point is (2, $9).
Example (continued): b) The consumer surplus at the equilibrium point is
2 é ù 3 2 x x 2 ò 2 × - + + 2 9 ( 3 ) 1 8 3 x x d x x - + + = ê ú 3 2 ë û 0 0 æ ö æ ö 3 2 3 2 ( 2 ) ( 2 ) ( 0 ) ( 0 ) = × + + × 1 8 3 2 3 0 - + + - ç ÷ ç ÷ è ø è ø 3 2 3 2 æ ö 8 4 2 2 = 1 8 6 0 - + + - = ç ÷ è ø 3 3 3 » $ 7 . 3 3 Example (concluded): b) The producer surplus at the equilibrium point is