Chapter 3 Exploratory Factor Analysis: Overview and Applications
Chapter 3 Exploratory Factor Analysis: Overview and Applications. Factor Analysis Overview What is it? Why use it?. Factor Analysis . . . analyzes the structure of the interrelationships among a large number of variables to determine a set of common underlying dimensions (factors).

Chapter 3 Exploratory Factor Analysis: Overview and Applications
E N D
Presentation Transcript
Chapter 3 Exploratory Factor Analysis: Overview and Applications
Factor Analysis Overview • What is it? • Why use it?
Factor Analysis . . . analyzes the structure of the interrelationships among a large number of variables to determine a set of common underlying dimensions (factors).
Two Types of Factor Analysis: • Exploratory Factor Analysis (EFA) = is used to discover the factor structure of a construct and examine its reliability. It is data driven. • Confirmatory Factor Analysis (CFA) = is used to confirm the fit of the hypothesized factor structure to the observed (sample) data. It is theory driven.
Application of Factor Analysis to a Fast-Food Restaurant Variables Factors Waiting Time Service Quality Cleanliness Friendly Employees Taste Food Quality Temperature Freshness
12 Dimensions of a Great Workplace Go On-Line www.gallup.com Item 1. I know what is expected of me at work. Item 2. I have the materials and equipment I need to do my work right. Item 3. At work, I have the opportunity to do what I do best everyday. Item 4. In the last seven days, I have received recognition or praise for doing good work. Item 5. My supervisor, or someone at work, seems to care about me as a person. Item 6. There is someone at work who encourages my development. Item 7. At work, my opinions seem to count. Item 8. The mission or purpose of my company makes me feel my job is important. Item 9. My fellow employees are committed to doing quality work. Item 10. I have a best friend at work. Item 11. In the last six months, someone at work has talked to me about my progress. Item 12. This last year, I have had opportunities at work to learn and grow. Possible constructs: 3, 8 & 12 = their job and its value; 4, 6 & 11 + possibly 7 = recognition, growth, etc.
Correlation Matrix of Variables After Grouping Using Factor Analysis Shaded areas represent variables likely to be grouped together by factor analysis.
What Can We Do WithExploratory Factor Analysis (EFA)? • Identify the structure of the relationships among a set of variables. • Identify representative variables from a much larger set of variables for use in subsequent analysis (individual variables or summated scores). • Create an entirely new set of variables for use in subsequent analysis (factor scores).
GINO'S Samouel's Restaurant Rotated Component Matrix – Samouel’s Customer Survey Components/Factors Variables 1 2 3 4 X1 – Excellent Food Quality .883 .141 .056 .093 X2 – Attractive Interior .008 -.056 .854 .001 X3 – Generous Portions .084 .116 .037 .896 X4 – Excellent Food Taste .912 .134 .065 .056 X5 – Good Value for the Money .239 .146 .107 .775 X6 – Friendly employees .049 .892 -.109 .048 X7 – Appears Clean and Neat .049 -.040 .751 .133 X8 – Fun Place to Go .007 -.086 .869 -.102 X9 – Wide Variety of Menu Items .901 -.059 .045 .055 X10 – Reasonable Prices -.074 -.056 -.072 .754 X11 – Courteous Employees -.022 .850 .007 -.037 X12 – Competent Employees .212 .800 -.107 .208
Rotated Component Matrix – Samouel’s Customer Survey Components/Factors Variables 1 2 3 4 X4 – Excellent Food Taste .912 X9 – Wide Variety of Menu Items .901 X1 – Excellent Food Quality .883 X6 – Friendly employees .892 X11 – Courteous Employees .850 X12 – Competent Employees .800 X8 – Fun Place to Go .869 X2 – Attractive Interior .854 X7 – Appears Clean and Neat .751 X3 – Generous Portions .896 X5 – Good Value for the Money .775 X10 – Reasonable Prices .754 Note: Loadings sorted by size and smaller loadings (<.3) removed.
Assumptions: • Multicollinearity. • Assessed using MSA (measure of sampling adequacy). • Homogeneity of sample factor solutions. The MSA is measured by the Kaiser-Meyer-Olkin (KMO) statistics. As a measure of sampling adequacy, the KMO predicts if data are likely to factor well based on correlation and partial correlation. KMO can be used to identify which variables to drop from the factor analysis because they lack multicollinearity. There is a KMO statistic for each individual variable, and their sum is the KMO overall statistic. KMO varies from 0 to 1.0. Overall KMO should be .50 or higher to proceed with factor analysis. If it is not, remove the variable with the lowest individual KMO statistic value one at a time until KMO overall rises above .50, and each individual variable KMO is above .50.
Decisions When Using Factor Analysis: • Extraction method? • Rotation approach? • Number of factors? • Which factor loadings are significant? • How to interpret the factor solution? • How to use factor results with other statistical techniques?
Extraction Decisions: • Which method? • Principal Components Analysis or Common Factor Analysis. • How to rotate? • Orthogonal or Oblique rotation.
Extraction Method Determines the Types of Variance Carried into the Factor Matrix Diagonal ValueVariance Unity (1) Communality Total Variance Common Specific and Error Variance extracted Variance not used
Principal Components vs. Common? Two Criteria: • Objectives of the factor analysis. • Amount of prior knowledge about • the variance in the variables.
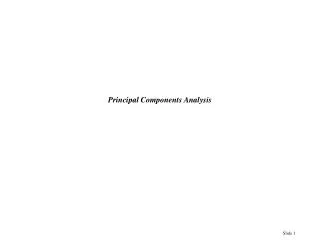
Orthogonal Factor Rotation Unrotated Factor II +1.0 +.50 Rotated Factor II V1 V2 Unrotated Factor I -1.0 -.50 0 +.50 +1.0 V3 V4 -.50 -1.0 Rotated Factor I V5
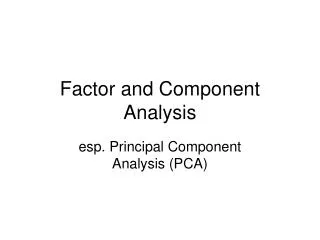
Oblique Factor Rotation Unrotated Factor II Orthogonal Rotation: Factor II +1.0 +.50 Oblique Rotation: Factor II V1 V2 Unrotated Factor I -1.0 -.50 0 +.50 +1.0 V3 V4 Oblique Rotation: Factor I -.50 -1.0 V5 Orthogonal Rotation: Factor I
Comparison Between Rotated and Unrotated Factor Loadings Unrotated Factor Loadings Rotated Factor Loadings Variables 1212 V1 .50 .80 .03 .94 V2 .60 .70 .16 .90 V3 .90 .25 .95 .24 V4 .80 -.30 .84 .15 V5 .60 -.50 .76 -.13
Orthogonal Rotation Methods: • Quartimax (simplify rows). • Varimax (simplify columns). • Equimax (combination).
Oblique Rotation Approaches: • SPSS = Direct OBLIMIN & Promax • SAS = ORTHOBLIQUE Note: With oblique factor rotation the output includes two factor matrices – pattern and structure. The pattern loadings are measures of the unique contribution each factor makes to the oblique factors. The structure loadings are the simple correlations of the variables with the oblique factors, and they contain both the unique variance between the variables and factors and the correlation among factors. These two factor matrices are seldom identical. Most researchers interpret the pattern matrix.
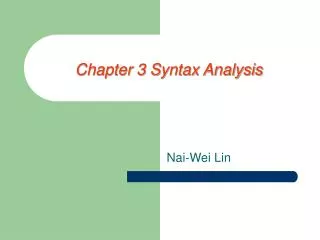
Number of Factors? • A Priori Criterion. • Latent Root Criterion. • Percentage of Variance. • Scree Test Criterion.
Reporting the Results of a Factor Analysis Varimax-Rotated Loadings Variables Factor 1 Factor 2 Communality X1 Delivery Speed -.787 .194 .66 X2 Price Level .724 .266 .58 X3 Price Flexibility -.804 -.011 .65 X4 Manufacturer’s Image .102 .933 .88 X6 Sales Force’s Image .025 .934 .87 X7 Product Quality .764 .179 .62 Total Sum of squares (eigenvalue) 2.38 1.87 4.25 Percentage of trace* 39.7 31.2 70.9 Important Point: Latent root criterion based on unrotated solution. *Trace = 6.0 (number of variables analyzed)
Eigenvalue Plot for Scree Test Criterion Latent Root Criterion Scree Test Criterion
Which Factor Loadings Are Significant? • Customary Criteria = Practical Significance. • Sample Size & Statistical Significance. • Number of Factors ( = >) and/or Variables ( = <).
Guidelines for Identifying Significant Factor Loadings Based on Sample Size Factor Loading Sample Size Needed for Significance* .30 350 .35 250 .40 200 .45 150 .50 120 .55 100 .60 85 .65 70 .70 60 .75 50 *Significance is based on a .05 significance level (a), a power level of 80 percent, and standard errors assumed to be twice those of conventional correlation coefficients.
Interpreting a Factor Matrix: Examine the factor matrix of loadings. Identify the highest loading across all factors for each variable. Assess communalities of the variables. Label the factors.
Reporting the Results of a Factor Analysis Varimax-Rotated Loadings Variables Factor 1 Factor 2 Communality X1 Delivery Speed -.787 .194 .66 X2 Price Level .724 .266 .58 X3 Price Flexibility -.804 -.011 .65 X4 Manufacturer’s Image .102 .933 .88 X6 Sales Force’s Image .025 .934 .87 X7 Product Quality .764 .179 .62 Total Sum of squares (eigenvalue) 2.38 1.87 4.25 Percentage of trace* 39.7 31.2 70.9 *Trace = 6.0 (number of variables analyzed)
Samouel's Restaurant Description of Employee Survey Variables Variable DescriptionVariable Type Work Environment Measures X1 I am paid fairly for the work I do. Metric X2 I am doing the kind of work I want. Metric X3 My supervisor gives credit an praise for work well done. Metric X4 There is a lot of cooperation among the members of my work group. Metric X5 My job allows me to learn new skills. Metric X6 My supervisor recognizes my potential. Metric X7 My work gives me a sense of accomplishment. Metric X8 My immediate work group functions as a team. Metric X9 My pay reflects the effort I put into doing my work. Metric X10 My supervisor is friendly and helpful. Metric X11 The members of my work group have the skills and/or training to do their job well. Metric X12 The benefits I receive are reasonable. Metric Relationship Measures X13 Loyalty – I have a sense of loyalty to Samouel’s restaurant. Metric X14 Effort – I am willing to put in a great deal of effort beyond that expected to help Samouel’s restaurant to be successful. Metric X15 Proud – I am proud to tell others that I work for Samouel’s restaurant. Metric Classification Variables X16 Intention to Search Metric X17 Length of Time an Employee Nonmetric X18 Work Type = Part-Time vs. Full-Time Nonmetric X19 Gender Nonmetric X20 Age Nonmetric X21 Performance Metric
Description of Customer Survey Variables GINO'S Samouel's Restaurant VS. Variable DescriptionVariable Type Restaurant Perceptions X1 Excellent Food Quality Metric X2 Attractive Interior Metric X3 Generous Portions Metric X4 Excellent Food Taste Metric X5 Good Value for the Money Metric X6 Friendly Employees Metric X7 Appears Clean & Neat Metric X8 Fun Place to Go Metric X9 Wide Variety of menu Items Metric X10 Reasonable Prices Metric X11 Courteous Employees Metric X12 Competent Employees Metric Selection Factor Rankings X13 Food Quality Nonmetric X14 Atmosphere Nonmetric X15 Prices Nonmetric X16 Employees Nonmetric Relationship Variables X17 Satisfaction Metric X18 Likely to Return in Future Metric X19 Recommend to Friend Metric X20 Frequency of Patronage Nonmetric X21 Length of Time a Customer Nonmetric Classification Variables X22 Gender Nonmetric X23 Age Nonmetric X24 Income Nonmetric X25 Competitor Nonmetric X26 Which AD Viewed (#1, 2 or 3) Nonmetric X27 AD Rating Metric X28 Respondents that Viewed Ads Nonmetric
DESCRIPTION OF DATABASE VARIABLES Variable Description Variable Type PERCEPTIONS OF HATCO X1 Delivery speed Metric X2 Price level Metric X3 Price flexibility Metric X4 Manufacturer’s image Metric X5 Overall service Metric X6 Salesforce image Metric X7 Product quality Metric PURCHASE OUTCOMES X9 Usage level Metric X10 Satisfaction level Metric PURCHASER CHARACTERISTICS X8 Size of firm Nonmetric X11 Specification buying Nonmetric X12 Structure of procurement Nonmetric X13 Type of industry Nonmetric X14 Type of buying situation Nonmetric
Using SPSS to Develop a Factor Solution for the Customer Survey For this analysis, we use all 200 respondents and do not split the sample. This is because we are looking for common patterns across all of the restaurant customers. The SPSS click through sequence is: Analyze Data Reduction Factor, which leads to a dialog box where you select variables X1 – X12. After you move these variables into the “Variables” box, look at the alternatives below. Click first on the Descriptives box and then on the Univariate descriptives box. Unclick the Initial solution box because we will not examine it, and then click Continue. Next click on the Extraction box. We will use the default method of Principal components and the Extract default of Eigenvalues over 1, but you unclick the unrotated factor solution under Display and then click on Continue. Next go to the Rotation box where the default is None. Since we will rotate the initial factor solution you click on Varimax as your rotational choice (this removes the default of None) and then Continue. Finally, go to the Options box and click on Sorted by size, and then change the Suppress absolute values less than from .10 to .3, and click on Continue. The last two choices make the output easier to read because we eliminate information we will not use. We will not be calculating factor scores at this point so we can click on “OK” to run the program.
Using SPSS to Develop a Factor Solution for the Employee Survey For this analysis, we use the 63 employee respondents. The SPSS click through sequence is: Analyze Data Reduction Factor, which leads to a dialog box where you select variables X1 – X12. After you move these variables into the “Variables” box, look at the alternatives below. Click first on the Descriptives box and then on the Univariate descriptives box at the top of the screen and the KMO and Anti-Image options at the bottom of the screen, and then continue. Next click on the Extraction box. We will use the default method of Principal components and the Extract default of Eigenvalues over 1, so now click on Continue. Next go to the Rotation box where the default is None. Since we will rotate the initial factor solution you click on Varimax as your rotational choice (this removes the default of None) and then Continue. Finally, go to the Options box and click on Sorted by size, and then change the Suppress absolute values less than from .10 to .3, and click on Continue. The last two choices make the output easier to read because we eliminate information we will not use. We will not be calculating factor scores at this point so we can click on “OK” to run the program. Note: Be sure to use the KMO/MSA and Anti-Image information to determine the variables to include in the final solution.
Samouel’s Employee Survey Factor Analysis – Application of MSA Procedure Overall MSA needs to be >.50, but you must also check MSA for each variable/item.
Samouel’s Employee Survey Factor Analysis – Application of MSA Procedures Individual Item MSA’s are on the diagonal of the anti-image correlation matrix.
Rotated Component Matrix – Samouel’s Employee Survey Three variables (X2, X5 & X7) were removed from this final solution as a result of examining the MSA data and the factor loadings matrix. Note also that smaller numbers are displayed in exponential format. For example, variable X3 on factor 1 is 4.947E-03. This loading is actually 0.004947 (3 decimal places to the left of where it is shown in the loadings matrix). This three factor solution extracted a total of 82.728 percent of the variance of the original nine variables.
“Easy-Read” Rotated Component Matrix – Samouel’s Employee Survey
Reliability Analysis for Three Variables Removed in Samouel’s Employee Survey Factor Analysis Individual item reliability measures Overall Alpha coefficient = reliability of construct
Reliability Analysis for Variables X3 , X6 & X10 (Supervision Factor) in Samouel’s Employee Survey Individual item reliability measures Overall Alpha coefficient = reliability of construct
Using Factor Analysis with Other Multivariate Techniques: • Select Surrogate Variables ? • Create Summated Scales ? • Calculate Factor Scores ?
“Easy-Read” Rotated Component Matrix – Samouel’s Employee Survey Samouel's Restaurant Components/Factors Variables 1 2 3 X12 – Benefits Reasonable .971 X1 – Paid Fairly .936 X9 – Pay Reflects Effort .923 X3 – Supervisor Praises .958 X6 – Supervisor Recognizes Potential .945 X10 – Supervisor Friendly/Helpful .773 X8 – Work Group/Cooperation .900 X4 – Work Group/Team .894 X11 – Work Group/Skills & Training .812 Note: Loadings sorted by size and smaller loadings (<.3) removed.
Rotated Component Matrix – Samouel’s Employee Survey Samouel's Restaurant Components/Factors Variables 1 2 3 X12 – Benefits Reasonable .971 -.049 -.061 X1 – Paid Fairly .936 .041 .083 X9 – Pay Reflects Effort .923 -.062 .023 X3 – Supervisor Praises .005 .958 .0009 X6 – Supervisor Recognizes Potential -.004 .945 .064 X10 – Supervisor Friendly/Helpful -.091 .773 .019 X8 – Work Group/Cooperation .104 .135 .900 X4 – Work Group/Team .035 -.145 .894 X11 – Work Group/Skills & Training -.082 .088 .812 Note: Loadings sorted by size.
Factor Scores . . . are composite scores calculated for each respondent on each of the derived factors.
Rotated Component Matrix – Samouel’s Customer Survey Samouel's Restaurant GINO'S Components/Factors Variables 1 2 3 4 X4 – Excellent Food Taste .912 .134 .065 .056 X9 – Wide Variety of Menu Items .901 -.059 .045 .055 X1 – Excellent Food Quality .883 .141 .056 .093 X6 – Friendly employees .049 .892 -.109 .048 X11 – Courteous Employees -.022 .850 .007 -.037 X12 – Competent Employees .212 .800 -.107 .208 X8 – Fun Place to Go .007 -.086 .869 -.102 X2 – Attractive Interior .008 -.056 .854 .001 X7 – Appears Clean and Neat .049 -.040 .751 .133 X3 – Generous Portions .084 .116 .037 .896 X5 – Good Value for the Money .239 .146 .107 .775 X10 – Reasonable Prices -.074 -.056 -.072 .754 Note: Loadings sorted by size.
Factor Scores for First Six Respondents in Survey of Samouel’s & Gino’s Customers FactorScores fac 1_1 fac2_1 fac3_1 fac4_1 Respondents #1 .58745 .34184 -.46724 -1.43820 #2 -.89212 1.24493 .84853 -.38169 #3 1.40450 .86863 -.49425 .34103 #4 -2.33246 -1.01861 .21274 .65610 #5 - .51894 .62113 -.74197 .39766 #6 - .55517 -1.14659 -.90178 -.91886
Summated Scales • . . . . are calculated by adding the original scale responses together and determining the mean value. Summated scales/scores = a method of combining several variables that measure the same concept into a single variable in an attempt to increase the reliability and validity of the measurement.
Rotated Component Matrix – Samouel’s Customer Survey Samouel's Restaurant GINO'S Components/Factors Variables 1 2 3 4 X4 – Excellent Food Taste .912 .134 .065 .056 X9 – Wide Variety of Menu Items .901 -.059 .045 .055 X1 – Excellent Food Quality .883 .141 .056 .093 X6 – Friendly employees .049 .892 -.109 .048 X11 – Courteous Employees -.022 .850 .007 -.037 X12 – Competent Employees .212 .800 -.107 .208 X8 – Fun Place to Go .007 -.086 .869 -.102 X2 – Attractive Interior .008 -.056 .854 .001 X7 – Appears Clean and Neat .049 -.040 .751 .133 X3 – Generous Portions .084 .116 .037 .896 X5 – Good Value for the Money .239 .146 .107 .775 X10 – Reasonable Prices -.074 -.056 -.072 .754 Note: Loadings sorted by size.