Download
1 / 1
10 likes | 70 Vues
Explore the use of a discriminator scan to determine neutron flux and correct for beam attenuation through matter for precision analysis in the NPDGamma experiment.

E N D
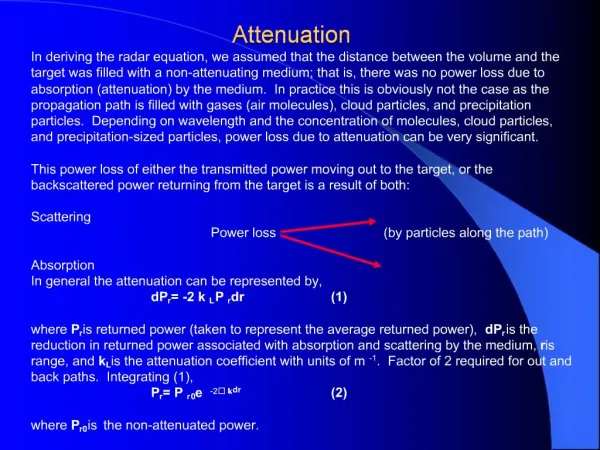
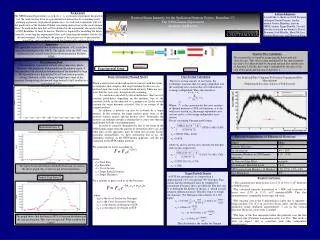
Discriminator Scan A discriminator was used to exclude any cosmic rays, photo-electrons, and gamma ray bckground from the neutron signal. A discriminator scan assisted in determination of the threshold voltage. We decided to use a threshold of 30 mV (our lowest possible setting). However, at this setting we might miss some of the neutrons. Extrapolating the upward slope towards 0 mV resulted in a correction of 7.9% Aperture 1 Aperture 2 Beam Attenuation Through Matter When a neutron travels through matter it interacts with the atoms or molecules that comprise that target medium. In the case of a neutron beam, the result is a reduction in intensity. There are two ways that this can occur, absorption and scattering. If a neutron is absorbed by the atom/nucleus there are two reaction possibilities depending on the medium. One of the reactions results in the emission of a gamma ray. In the second reaction the target becomes activated; that is, an isotope of the original nucleus. In addition, a neutron can also be scattered by a target nucleus. In this scenario, the target nucleus gains some of the neutron's kinetic energy, and the neutron slows. Eventually, the neutron can undergo enough scattering that it comes into thermal equilibrium with the surrounding matter. In order to correctly determine the flux at any point in the NPDGamma target room the amount of attenuation due to air, and other parts of the apparatus, must be taken into account. In this particular measurement, we have attenuation due to air, the aluminum windows in the NPDGamma apparatus, and the gas contained in the NPDGamma monitors. We estimated our losses according to: where, F = Total Flux F0= Raw Flux s = Cross Section n = Target Particle Density x = Target Thickness For a mixture of gases such as air this becomes: Our Polarized Flux Compared To Previous Unpolarized Flux Measurement (Unpolarized flux data courtesy of Erik Iverson) The cross section consists of two terms, the exothermic reactions that are energy dependent and the scattering cross section that, for cold neutrons, is energy independent. Thus, the relation is, Where, is the correction for the cross sections of thermal neutrons to SNS cold neutrons, is the total cross section, in the energy dependent cross section, and el is the energy independent cross section. For air containing Nitrogen and Oxygen, where Nand O are the cross sections for nitrogen and oxygen, respectively Percent Attenuation of Measured Neutrons Target Particle Density At NTP the atmospheric air composition is approximately 21% Oxygen and 79% Nitrogen. This means that the attenuation must be weighted by percentage. For gases this is not difficult. The first step is to determine the density of the gas, n, which is easily found in reference sources. The next step is to weigh the densities. For Nitrogen with a density of 1.165 kg/m3, where, sN= is the Cross Section for Nitrogen sO= is the Cross Section for Oxygen nN = isthe density of Nitrogen at NTP nO = is the density of Oxygen at NTP The calculation is the similar for Oxygen. Background The NPDGamma Experiment, n + p d + , is a precision experiment designed to test the weak nuclear force in a proton/neutron interaction by examining parity violating asymmetry in produced gamma rays. As such, this experiment will test the predictions of the Standard Model concerning interactions of the weak nuclear force. To analyze the data that will be obtained in the experiment, the neutron flux at SNS Beamline 13 must be known. The flux is required for modeling the beam correctly, correcting the experimental data, and estimating the needed statistics for the measurement. Accordingly, the purpose of this project was to measure the actual flux, and to compare it with the theoretically predicted value. Acknowledgments I would like to thank my FaST Program colleague Daniel Parsons, faculty mentor Joshua Hamblen, and our ORNL mentor Seppo Penttila. I would also like to extend my thanks to David Bowman, Paul Mueller, Mark McCrea, Septimu Balascuta, and Zhaowen Tang. Neutron Beam Intensity for the Spallation Neutron Source Beamline 13:The NPDGamma ExperimentAnalysis and ResultsJeremy StewartUniversity of Tennessee at Chattanooga Apparatus The apparatus consisted of two cadmium apertures, a 6Li scintillator, and a photomultiplier tube (PMT). The signals from the PMT were conditioned and counted using Nuclear Instrumentation Modules (NIM). Neutron Flux Calculation The neutron flux is found by integrating the horizontal and vertical scans. This value is then multiplied by the step increment in x and y. It is then divided by the peak neutron flux and the area of Aperture 2. Finally, this value is multiplied by the ratio of the area of the guide and the area of Aperture 1. Experimental Setup Cross Section Calculation Horizontal Scan, Sx Divergent beam distributions should be Gaussian. As seen in the above graph, this is what we get in horizontal data. Vertical Scan Data, Sy • Results/Conclusions • * The calculated raw neutron flux was (2.78 ± 0.18) x 109 neutron/s at 800kW power. • *The calculated intensity normalized to 1 MW and corrected for losses was (5.70 ± 0.37) x109 neutrons/s/MW. This flux measurement is comparable to the expected value. • *The structure seen in the Y distribution is likely due to Aperture 1 being installed 3.81 ± 0.16 cm below beam center, and the neutron moderator being displaced approximately 1 cm in the vertical direction. However, more study is needed. • *The ratio of the flux measured before the polarizer over the flux measured after (Polarizer transmission ratio) was 28%. This result is what we expect, and is consistent with other independent measurements. The graph shows that the beam is NOT a Gaussian distribution in the vertical direction. This was not expected! What could be the cause?