Distribution System Efficiency Voltage Optimization
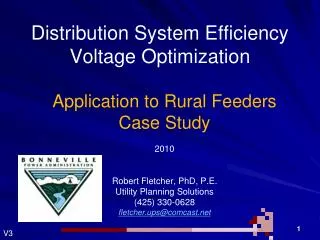
Distribution System Efficiency Voltage Optimization. Application to Rural Feeders Case Study 2010 Robert Fletcher, PhD, P.E. Utility Planning Solutions (425) 330-0628 fletcher.ups@comcast.net. V3. Rural Feeders. Overhead Rural Feeder. Rural Distribution Substation.

Distribution System Efficiency Voltage Optimization
E N D
Presentation Transcript
Distribution System Efficiency Voltage Optimization Application to Rural Feeders Case Study 2010 Robert Fletcher, PhD, P.E. Utility Planning Solutions (425) 330-0628 fletcher.ups@comcast.net Robert H Fletcher V3
Rural Feeders Overhead Rural Feeder Rural Distribution Substation Long Feeders (5 to 15 miles) Long single phase laterals Low voltage (<114V) at end of feeders Large neutral currents Large Ampere Phase unbalance Low Customer Density (<1000 kW per sq mi) Line Regulators are typically applied Feeder wire sizes are small compared to urban 2
Rural Feeder Considerations • Rural feeder service infrastructure costs per customer are high compared with urban feeders. • Rural feeder voltage drops are typically higher than urban feeders and typically require line regulators. • Line Regulators are used to establish both non-VO or VO voltage-control-zones. Energy savings are not determined for non-VO control zones. • Significant system reconfiguration, phase upgrade, load balance, capacitors and line regulators are typically needed for VO on rural feeders. • All minimum system thresholds must be applied for all rural feeder VO voltage-control-zones. 3
Allowed ANSI Service Voltage Range 126 – 114 V (120 V ± 5%) Volts 126 National Average 120 114 Rural and Urban FeedersAverage Customer Service Voltage Non CVR ± 2.5% With CVR • DSE and VO System Objectives • Reduce End-Use energy Consumption (reduce average service voltage) • Increase Distribution System Efficiency (lower losses) • Improve Service Reliability and Voltage Quality (increase backup capability) 4
Rural Feeder DSE & VO Design Process • Gather Substation Area Data • Substation Annual MWh delivered • Feeder Peak KW and kVAr hourly load patterns • Feeder connected kVA and locations • Feeder phase ampere demands. • Voltage Control settings for Substation, Line Regulators, and Capacitors • Establish System Modeling • Feeder conductor characteristics (OH & UG) and locations • Feeder connected kVA and locations • Line phase configuration locations (i.e. single phase, two phase, three phase) • Line voltage regulator and shunt capacitor locations • Determine System Characteristics • Indentify system load factor LDF and loss factor LSF • Determine minimum allowed primary volts (on 120 V base) 5
Perform Peak Load Flow Simulation – Existing System • Perform peak load flow simulation for existing system • Determine maximum voltage drops for all feeders and voltage-control-zones • Identify VO system non-compliance with operation thresholds (bal, pf, volt drop) • Determine existing system peak line loss • Perform Average Load Flow Simulation(s) – Existing System • Perform average load flow iterative simulations to determine solutions to meet (bal and pf) thresholds: • Perform Peak Load Flow Simulation(s) – with Improvements • Perform peak load flow iterative simulations to determine solution(s) to meet (volt-drop) thresholds and optimal VO design: • Determine maximum volt-drop for each VO voltage-control-zone • Determine system peak line loss with improvements (Pre-VO) • Revised lateral taps • Var Compensation (Capacitors) • Load balancing • Phase upgrades • Reconductoring • Voltage-Control-Zones (new or modified) • Switching • Load Transfers 6
Perform Pre-VO Operation Assessment • Identify kVA connected for each voltage-control-zone • Determine kW load for each VO voltage-control-zone • Identify feeder volt-drop % variance for VO substation feeders • Indentify Pre-VO voltage control settings for each VO voltage-control-zone • Calculate Pre-VO Weighted Average Voltage • Perform Post-VO Operation Assessment • Indentify Pre-VO voltage control settings for each VO voltage-control-zone • Calculate Post-VO Weighted Average Voltage • Determine average change in customer voltage • Determine System VO Factor • Identify % of customers with electric space heating for substation area • Identify % of commercial load for substation area • Identify climate zone for substation area • Using ESUE Calculator, determine VO Factor 7
Determine Expected DSE & VO Energy Savings • Distribution System line loss change (MWh/yr) • Connected kV A no-load loss reduction (MWh/yr) • VO Energy Savings (MWh/yr) • Perform Economic Life-Cycle Cost Evaluation • Estimate Costs • Identify Financial Factors • Determine Economic Impacts • Identify Metering and Engineering Analysis Recommendations • Installation Costs • Annual O&M Costs • Marginal cost of Energy • BPA Incentive Payment • Inflation Rates • Present Worth Factors • Utility Net Revenue Requirements • Life Cycle Cost of Energy Saved • Benefit Cost Ratio • NPV Benefits & Costs 8
Rural Feeders DSE & VO Case Study • 1-15/20/25 MVA Power Transformers with four feeders • Mix of Rural and Urban Feeders in Climate Zone H2 and C2 • Average customer % electric heat is 50% • Substation LTC provides only voltage regulation – Reg Volt Set is 125 V • No Line Voltage Regulators are installed, mix of existing capacitors • Power Factor is poor due to lack of capacitors 9
Perform Peak Load Flow Simulations – Existing System FDR 1 • Substation Service Area: • 3806 customers • Four Feeders • Mix of Rural and Urban Load • Service area 10 mile x 7 mile • Average 300 kW per sq mi FDR 2 Legend: FDR 1 FDR 2 FDR 3 FDR 4 FDR 4 FDR 3 10
Perform Peak Load Flow Simulations – Existing System Urban Area • FDR 1 – Rural • FDR 2 – Urban & Rural • FDR 3 – Urban & Rural • FDR 4 – Urban & Rural Legend: FDR 1 FDR 2 FDR 3 FDR 4 11
Perform Peak Load Flow Simulations – Existing System FDR 1 • Rural Feeders have mostly 336 kCM AAC • Urban Areas have 795 kCM AAC conductor as substation get-a-ways • Laterals are 2/0AA FDR 2 • Legend: • 795 kCM AAC • 336 kCM AAC FDR 4 FDR 3 2/0 AA 12
Perform Peak Load Flow Simulations – Existing System Urban Area • Rural Feeders have mostly 336 kCM AAC • Urban Areas have 795 kCM AAC conductor as substation get-a-ways • Laterals are 2/0AA • Legend: • 795 kCM AAC • 336 kCM AAC 2/0 AA 13
120.2 4.01 13.3 117.0 6.64 10.9 Perform Peak Load Flow Simulations – Existing System 118.7 5.26 8.4 117.7 6.12 9.6 FDR 1 • Identify Non-Compliance Issues: • High Load Unbalance • Poor power factor • Low primary voltage • High voltage drops • Poor Voltage Variance • Determine peak line loss (191 kW) 121.0 3.33 6.5 FDR 2 120.3 2.24 6.8 • Legend: • 117.0Volts (lowest phase) • 6.64%Volt drop % Accum • 10.9Miles from 3ource FDR 4 FDR 3 14
Perform Peak Load Flow Simulations – Existing System Urban Area • Power Factors at Peak • FDR 1 95.0% • FDR 2 95.0% • FDR 3 94.9% • FDR 4 94.9% 122.6 1.74 2.3 123.6 1.2 1.4 123.4 1.31 2.7 124.1 0.67 2.8 • Legend: • 117.0Volts (lowest phase) • 6.64%Volt drop % Accum • 10.9Miles from 3ource 15
117.0 6.64 10.9 120.2 4.01 13.3 Perform Peak Load Flow Simulations – Existing System 118.7 5.26 8.4 117.7 6.12 9.6 FDR 1 • Determine Minimum Primary Volts FDR 2 FDR 4 FDR 3 Legend: Voltages below 119.8 V 16
5. Perform Average Load Flow Simulation(s) – Existing System • Perform average load flow iterative solution(s) to identify upgrades to meet thresholds (bal, pf): • Load balancing • Phase upgrades • Revised lateral taps • Var compensation (Caps) Fixed Capacitors needed to achieve 100% power factor for average kW load conditions Average Load Flow Scenario P =41% Q = 60% Average_kVAr_Demand = Annual_kVArh / 8760 hr 17
Plan New 119.1 4.93 13.1 119.0 4.99 13.3 Perform Peak Load Flow Simulations – with Improvements 2 to 3ph 1 to 2ph 121.6 2.82 8.4 119.7 4.44 9.6 3 to 2ph • Perform peak load flow to assess (volt drop): • After Balance, Phase, and Capacitor Upgrades 1 to 3ph 122.0 2.50 6.5 18 Lat Taps 122.9 1.5 6.8 Legend: OAdded 11-300 kVAr Capacitors 3 phase 18
Perform Peak Load Flow Simulations – with Improvements Urban Area • Perform peak load flow to assess (volt drop): • After Balance and Capacitor Upgrades 123.0 1.33 2.3 124.1 0.73 1.4 124.1 0.79 2.7 Legend: OAdded 300 kVAr Capacitors 3 phase 124.5 0.45 2.8 19
Perform Peak Load Flow Simulations – with Improvements • After adding Balanced and Capacitor upgrades, next identify system reconfigurations to meet (volt drop) thresholds • Switching • Load transfers • Reconductoring • New feeders • New voltage control zones • Consider Switching to add load to FDR 4 from FDR 2 and FDR 3 20
Perform Peak Load Flow Simulations – with Improvements The Pre-VO system is how the system looks before initiating VO • Determine distribution of connected kVA • After Switching Determine peak line loss (161 kW) and power factors 21
119.1 4.93 13.1 119.0 4.99 13.3 Perform Peak Load Flow Simulations – with Improvements 121.8 2.66 8.6 119.7 4.44 9.6 • Perform peak load flow to assess (volt drop): • After Switching Upgrades 122.3 2.25 6.5 • Maximum Feeder Volt drops • FDR 1 4.99% • FDR 2 2.66% • FDR 3 1.85% 122.4 1.85 6.8 22
Perform Peak Load Flow Simulations – with Improvements Urban Area • Perform peak load flow to assess (volt drop): • After Switching Upgrades 123.6 1.18 1.6 123.7 1.1 1.4 • Maximum Feeder Volt drops • FDR 4 1.57% 123.9 0.95 2.2 123.1 1.57 3.1 23
Perform Peak Load Flow Simulations – with Improvements • After adding Balanced and Capacitor upgrades, next identify system reconfigurations to meet (volt drop) thresholds • Switching • Load transfers • Reconductoring • New feeders • New voltage control zones • Consider Additional Voltage Control Zones • Add VO voltage control zone to FDR 1A at 1.86% • Add VO voltage control zone to FDR 1B at 2.05% • Add VO voltage control zone to FDR 2 at 1.55% 24
119.1 4.93 10.9 119.0 4.99 13.3 Perform Peak Load Flow Simulations – with Improvements FDR 1B 121.8 2.66 8.6 119.7 4.44 9.6 • Perform peak load flow to assess (volt drop): • Identify possible locations of voltage control zones FDR 2 122.3 2.25 6.5 2.05% FDR 1A 1.55% 122.4 1.85 6.8 Legend: Accumulated volt drop% 0.0 to 1.5% 1.5 to 2.5% 2.5 to 3.5% 3.5 to 5.0% 1.85% SUB LTC 25
123.0 1.60 10.9 123.0 1.68 13.3 Perform Peak Load Flow Simulations – with Improvements 122.6 2.00 8.6 • Simulate system with new control zones for volt drop improvements • Added three New Voltage Control Zones 123.6 1.15 9.6 122.3 2.25 6.5 122.7 2.05 6.0 123.3 1.55 3.1 Legend: New Voltage Regulators Accumulated volt drop% 0.0 to 1.5% 1.5 to 2.5% 2.5 to 3.5% 3.5 to 5.0% 122.7 1.86 3.2 123.2 1.85 6.8 123.1 1.57 3.1 26
Perform Peak Load Flow Simulations – with Improvements Urban Area • No Line Regulators added for in urban area 123.6 1.18 1.6 123.7 1.10 1.4 124.1 0.79 2.7 123.1 1.57 3.1 27
Summary of DSE & VO Improvements 1ph to 2ph 2/0AA 1.3 mi 2ph to 3ph 2/0AA 1.3 mi • $375,000 2ph to 3ph 2/0AA 1.6 mi 1ph to 3ph 2/0AA 0.3 mi Reg & EOL Metering 11-300 kVAr Capacitors • Legend: • 795 kCM • 336 kCM 3-219A Line Regulators 18 lateral tap revisions 2/0 AA 28
7. Perform Pre-VO Operation Assessment Determine kW load for each voltage-control-zone 29
7. Perform Pre-VO Operation Assessment Determine Post-VO Weighted Average Voltage After Capacitors, Reconfiguration, and Regulators Added Assign a fixed 124 V for all new voltage control zones regulation sources 30 Reg_Set_Volt – ½ * A * LDF
Determine Post-VO Weighted Adjusted Voltage After Capacitors, Reconfiguration, and Regulators Added 8. Perform Post-VO Operation Assessment Assign LDC set voltage of 120 V for all voltage control zones regulation sources Reg_Set_Volt + LDF * (½ * A + (B – A)) 31
Determine System VO Factor • Identify % of customers with electric space heating for substation area 50% • Identify % of commercial load for substation area 20% • Identify climate zone for substation area H2 & C2 • Using ESUE Calculator, determine VO Factor (pu) 0.450 Change in Energy = VO Factor(pu) * Total MWh Load * Average Voltage Change (pu) 32
10. Determine Expected DSE & VO Energy Savings Distribution System Efficiency Savings Distribution System Energy Savings from VO improvements (1-(1/(1.030))2) * 1159 33
10. Determine Expected DSE & VO Energy Savings Distribution System VO Energy Savings 34
10. Determine Expected DSE & VO Energy Savings Distribution System DSE & VO Total Energy Savings 35
11. Perform Economic Life-Cycle Cost Evaluation Distribution System DSE & VO Economic Evaluation Utility Inputs 36
11. Perform Economic Life-Cycle Cost Evaluation Distribution System DSE & VO Economic Evaluation BPA Costs 37
11. Perform Economic Life-Cycle Cost Evaluation Distribution System DSE & VO Economic Evaluation Utility Benefits and Costs 38
11. Perform Economic Life-Cycle Cost Evaluation Distribution System DSE & VO Economic Evaluation Customer Benefits and Costs 39
CommentsandQuestions 40 Robert H Fletcher, PLLC