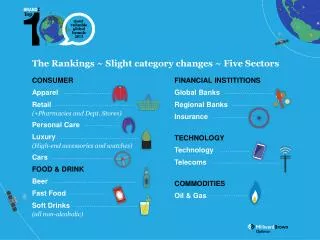
The Rankings ~ Slight category changes ~ Five Sectors
340 likes | 450 Vues
This report explores category changes and growth trends across five key sectors: Financial Institutions, Technology, Commodities, Consumer Products, and Food & Drink. It analyzes brand value dynamics, including the financial contribution of brands and the significance of consumer perceptions. Despite economic challenges, many brands have demonstrated resilience and growth, particularly in Asia. Key findings highlight the importance of brand distinctiveness, the influence of technology, and shifting consumer preferences. The report compares BrandZ and Interbrand metrics, shedding light on brand performance in a competitive landscape.

The Rankings ~ Slight category changes ~ Five Sectors
E N D
Presentation Transcript
The Rankings ~ Slight category changes ~ Five Sectors FINANCIAL INSTITITIONS Global Banks Regional Banks Insurance TECHNOLOGY Technology Telecoms COMMODITIES Oil & Gas CONSUMER Apparel Retail (+Pharmacies and Dept. Stores) Personal Care Luxury (High-end accessories and watches) Cars FOOD & DRINK Beer Fast Food Soft Drinks (all non-alcoholic)
BrandZvsInterbrand BRAND VALUE FinancialValue ($) BrandContribution(%) Financial value of the brand rather than the company The proportion of financial value that is attributable to the brand alone KEY DIFFERENTIATOR
BrandZ extensive consumer research
Interbrand’s assessment of brand Expert panelassessment Historical role of brandfor othersin sector Primaryresearch Highlysubjective Flawedassumption Limited INCONSISTENT
Interbrand’s “global” exclusion criteria Interbrand EXCLUDES 52% of world’s largest public brands
BrandZ Strong Brand Portfolio vs. Interbrand T50 vs. S&P 500 (April 2006 – April 2013) 60% 58% 39% 40% 23% 20% April 06 April 13 -20% BrandZ Strong Brands Portfolio Interbrand Top Brands Portfolio S&P 500 -40% -60% Note: BrandZ strong brands are those with a brand contribution of 30% or more
Top brands value continues to grow UP +7% to $2.6tr +32% +77% since 2008 since 2006(pre-recession) +7% $2.6tr
GROWTH All categories show growth (except Technology, Oil & Gas) Top brands defy slowdown in Europe/UK. Asia leads growth, US recovers and LatAm suffers. FINANCIAL INSTITUTIONS Banks have bounced back into profit TECHNOLOGY Technology continues to dominate and influence VALUE Luxury and Value co-exist GLOBAL IS NOT AUTOMATIC PANACEA Many regional brands bigger than global competitors
All categories up except Technology/ Oil & Gas) Category Size & Growth (Top 10) vs 2012 IN ORDER OF GROWTH
Only Cars still behind pre-Recession values Category Growth (Top 10) IN ORDER OF GROWTH
Banks back making profits They may not be popular but they are valuable infrastructure and can be profitable exports
Financial: Top 10 Global Banks Category+23%
The Soft Drinks ‘share of throat’ increasingly being affected by health concerns and threatened legislation
Food & Drink: Top 15 Soft Drinks Category Top 15 +5%
Volatility across Technology category A temporary lull in game changing innovations US still dominates
Technology: Top 10 Technology Category Top 10 -1%
How many bottles of L’OréalElvive Triple Resist Reinforcing Shampoo would you get for the global brand value of L’Oréal? 1 billion 3 billion 5 billion • How many Amazon delivery trucks would you need to get them to your home? 40,000 100,000 300,000 • How long would the supply last an average family? 10 years 99 years 250m years
Key themes Meaningfully different and salient brands: POWER drive higher volume sales PREMIUM maximise ability to charge a fair price POTENTIAL sustain growth for the future
Top 100 Brands MEANINGFUL 115 DIFFERENT 120 SALIENT 131 Average for all brands 100
Eight Years, Eight Top Risers • Up+425% • Top 100 up+77%
Eight Success Trends Great Value Proposition Relevant for today Harnessing technology Getting abroad and about Reputation Meaningfully Different Personality A great branded experience
+13% Rankings: Top 10 Asia
-13% Rankings: Top 10 LatAm
+2% Rankings: Top 10 North America (Canada: RBC 38th, TD 46th, Scotiabank 85th)
+4% Rankings: Top 10 UK
+5% Rankings: Top 10 Continental Europe
Key Take Aways PURPOSE CONSUMERS COMMUNICATION GROWTH
Corporate Reputation becoming more important RepZ key measures of Top 100 (2013) RepZScore 106