Download
1 / 39
390 likes | 543 Vues
Cross-Price, Income and Supply Elasticities. Overheads. Income Elasticity of Demand. The income elasticity of demand is defined as the percentage change in quantity divided by the percentage change in income,. all other influences remaining constant.

E N D
Income Elasticity of Demand The income elasticity of demand is defined as the percentage change in quantity divided by the percentage change in income, all other influences remaining constant
Price and Income Elasticities of Demand Income elasticity measures shifts in the demand curve Price elasticity measures movements along the curve
D1, I = 3000 D2, I = 4000 Graphical Analysis Demand for Q 32 30 Price 28 26 24 22 20 18 16 14 12 10 8 6 20 30 40 50 60 70 80 90 100 110 120 Quantity
Computing price elasticity (income constant) PriceIncomeDemand 13.00 3000.00 68.75 14.00 3000.00 63.74 20.00 3000.00 44.20 21.00 3000.00 42.03 13.00 4000.00 91.83 14.00 4000.00 85.17 20.00 4000.00 59.20 21.00 4000.00 56.31
Price Elasticity of Demand (Income = 4000) PriceIncome Demand 20.00 4000.00 59.20 21.00 4000.00 56.31
Price Elasticity of Demand (Income = 3000) PriceIncome Demand 20.00 3000.00 44.20 21.00 3000.00 42.03 -1.0257
PriceIncomeDemand 13.00 3000.00 68.75 14.00 3000.00 63.74 20.00 3000.00 44.20 21.00 3000.00 42.03 13.00 4000.00 91.83 14.00 4000.00 85.17 20.00 4000.00 59.20 21.00 4000.00 56.31 Computing income elasticity (price constant)
PriceIncomeDemand 13.00 3000.00 68.75 14.00 3000.00 63.74 20.00 3000.00 44.20 21.00 3000.00 42.03 Q 13.00 4000.00 91.83 14.00 4000.00 85.17 20.00 4000.00 59.20 21.00 4000.00 56.31 Computing income elasticity (price constant)
PriceIncomeDemand 13.00 3000.00 68.75 14.00 3000.00 63.74 20.00 3000.0044.20 21.00 3000.00 42.03 Q I 13.00 4000.00 91.83 14.00 4000.00 85.17 20.00 4000.0059.20 21.00 4000.00 56.31 Demand Data on Q
Income Elasticity of Demand PriceIncomeDemand 20.00 3000.00 44.20 20.00 4000.00 59.20
Normal and Inferior Goods Normal goods have a positive income elasticity Inferior goods have a negative income elasticity
Necessities and Luxuries Necessities typically have an income elasticity between 0 and 1 Luxuries typically have an income elasticity greater than 1
Examples Fresh Fruit Meat (Steak) Potatoes Food Transportation (???) Eating out Cigarettes
Cross-price Elasticity of Demand The cross price elasticity of demand is defined as the percentage change in the quantity demanded of one good, divided by the percentage change in the price of a different good, all other influences remaining constant We denote the cross price elasticity of good i for good j as ij where
Elasticities of Demand Price elasticity measures movements along the curve Income elasticity measures shifts in the demand curve Cross-price elasticity measures shifts in the demand curve
D1, P2 = 10 D1, P2 = 50 Graphical Analysis Demand for Q1 32 30 Price 28 26 24 22 20 18 16 14 12 10 8 20 30 40 50 60 70 80 90 100 Quantity
Demand Data for Alternative Prices of Good 2 P1P2IncomeD1 13.00 10.00 3,000 68.75 14.00 10.00 3,000 63.74 20.00 10.00 3,000 44.20 21.00 10.00 3,000 42.03 13.00 50.00 3,000 72.45 14.00 50.00 3,000 67.17 20.00 50.00 3,000 46.60 21.00 50.00 3,000 44.31 22.00 50.00 3,000 42.24
Demand Data for Alternative Prices of Good 2 P1P2IncomeD1 13.00 10.00 3,000 68.75 14.00 10.00 3,000 63.74 20.00 10.00 3,000 44.20 21.00 10.00 3,000 42.03 13.00 50.00 3,000 72.45 14.00 50.00 3,000 67.17 20.00 50.00 3,000 46.60 21.0050.003,000 44.31 22.00 50.00 3,000 42.24
Price Elasticity of Demand PriceIncome Demand 20.00 3000.00 44.20 21.00 3000.00 42.03
Cross-price elasticity of demand for good 1 as the price of good 2 changes from $10 to $50 P1 P2 Income D1 20.00 10.00 3,000 44.20 20.00 50.00 3,000 46.60
Substitutes and Complements Goods are said to be substitutes if ij > 0 Demand goes up as other price goes up Goods are said to be complements if ij < 0 Demand goes down as other price goes up Goods are said to be close substitutes if ij >> 0
Substitutes Beef and Pork Rice Chex and Life Cereal Ford and Dodge Cars Margarine and Butter
Complements Printers and Printer Paper Cars and Gasoline Food and Entertainment Televisions and VCRs
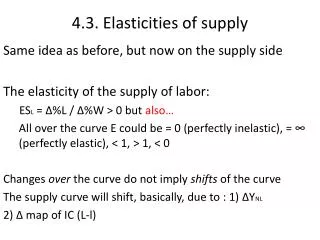
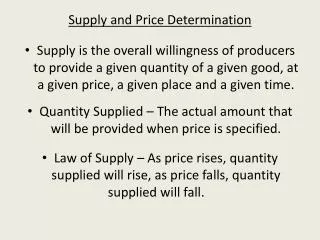
Elasticity of Supply The elasticity of supply is defined as the percentage change in quantity supplied divided by the percentage change in price, all other influences remaining constant
The elasticity of supply measures movements along the supply curve
Graphical Analysis Supply of Shirts 400 375 Price 350 325 300 275 250 225 200 175 150 125 100 75 50 25 0 0 10 20 30 40 50 60 70 80 90 100 Quantity
Supply Data Q P 0 0 5 20 10 40 15 60 20 80 25 100 30 120 35 140 40 160 45 180 50 200 55 220 60 240
Another Example of Elasticity of Supply Q P 50 200 55 220
Factors affecting the elasticity of supply Supply will be more elastic, the more alternatives producers of it have for production. Supply will be more elastic if the market is defined narrowly. Supply will be more inelastic if there are biological or other lags in production Supply will be much more elastic in the long run.
Classification of the elasticity of supply Inelastic supply When the numerical value of the elasticity of supply is between 0 and 1.0, we say that supply is inelastic.
Classification of the elasticity of supply Elastic supply When the numerical value of the elasticity of supply is greater than 1.0, we say that supply is elastic.
Classification of the elasticity of supply Unitary elastic supply When the numerical value of the elasticity of supply is equal to 1.0, we say that supply is unitary elastic.
Classification of the elasticity of supply Perfectly inelastic - S = 0 vertical Very short run response Perfectly elastic - S = horizontal
Analysis of an agricultural market Demand for food and food products is generally price inelastic Supply of many crops is stochastic due to weather, disease, etc Thus we tend to see large changes in price and thus net farm income