Download
1 / 30
300 likes | 441 Vues
HOW DO SCIENTISTS IN THE REAL WORLD USE TIME-SERIES DATA?. Who collects data? What are some stories behind data? How much data is enough? How is the data being used? What is different to what we teach?. WHO COLLECTS DATA?. Many different organisations… Regional and local councils.

E N D
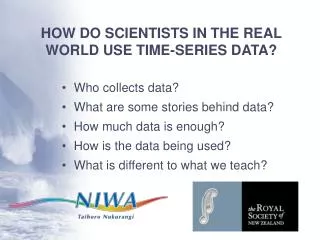
HOW DO SCIENTISTS IN THE REAL WORLD USE TIME-SERIES DATA? • Who collects data? • What are some stories behind data? • How much data is enough? • How is the data being used? • What is different to what we teach?
WHO COLLECTS DATA? Many different organisations… • Regional and local councils. • Transit NZ. • Research institutes e.g. NIWA • Consulting firms e.g. BECA • Schools.
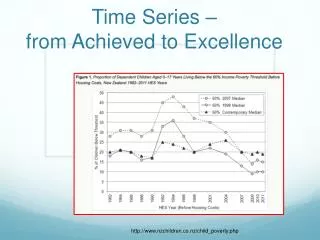
Importance of long term trend. Contexts for correlation and interpolation. Using one set of data to create another. Importance of data over long time periods. Different analysis techniques. Think about and question what we teach. OVERVIEW
DATA TOLD SCIENTISTS… • Health of Mahurangi Harbour in decline. • Increased sedimentation was smothering marine life and causing a decline in diversity. • Common shellfish no longer found in some areas. • Boating had become more difficult because of reduced water depths.
MAHURANGI ACTION PLAN Goal: Halt, slow or reverse the adverse effects of sedimentation. • Fence-off streams, waterways and wetlands. • Undertake riparian planting. • Conduct a sediment source assessment. • Change land management practices. • Extensive environmental education.
ANNUAL NITRATE ACCUMULATIONTREND OR CYCLE? NO3-N increasing trend
WHAT MODEL IS THE BEST FIT? ? Model prediction A polynomial model with a 9-year cycle gives a good fit .. r2 = 0.9
OTHER EVIDENCE In the last 10 years, mean chlorophyll a concentrations have more than doubled
0.18 ± 0.07 mg m-3 y-1 0.072 ± 0.027 mg m-3 y-1 FURTHER ANALYSIS Winter (r2 = 0.78) Annual Average (r2 = 0.77) Summer (r2 = 0.57)
PROTECTING LAKE TAUPO STRATEGY Goal: Reduce nitrogen run off by 20%. • Regional plan change. • Launch an $81.5 million fund. • Encourage and assist land use change. • More restrictive wastewater practices.
SH20 WATERVIEW CONNECTION A 3.2 km tunnel to connect SH20 at Maioro St in Mt Roskill to the northwestern motorway SH16 at Waterview by Great South Rd
PRIOR KNOWLEDGE TO INFORM PLANNING • In drilling this tunnel, how much ground water will be removed? • What effects will this have on the flow and ecosystem of Oakley Creek? • What are the usual flow levels in Oakley Creek? • What monitoring information is available on flow rates of Oakley Creek?
USING ONE SET OF TIME-SERIES DATA TO CREATE ANOTHER • Use flow rates from a monitored creek in a nearby catchment. • Check relationship with the small amount of flow data from Oakley Creek. • Generate Oakley Creek flow data set. • Use this as input for groundwater models. • Establish impact on ecosystem.
WITHIN OUR CURRICULUM - DO WE TEACH THIS? • Establish a relationship between two data sets and then use one set to complete another. • Graphs or diagrams based on anomalies. • Different time – series analysis.
WAS MAY HOTTER THAN USUAL? • http://www.niwa.co.nz/edu/resources/climate • http://cliflo-niwa.niwa.co.nz/
YES! 26 days were warmer than average for May and only 5 days were colder than average.
DENDROCHRONOLOGY TREE + TIME-STUDY • Oxygen isotope signal correlates to temperature. • Ring-width correlates to periods of low river flow. • Useful for improving climate model results.


![[Report] Real-Time Marketing: The Agility to Leverage 'Now' by Rebecca Lieb](https://cdn4.slideserve.com/7672878/a-market-definition-report-real-time-marketing-dt.jpg)