T he interquartile range, the range and the mode
T he interquartile range, the range and the mode. SUMMARY STATISTICS. After displaying data using a histogram or stem plot, we can make even more sense of the data by calculating what are called summary statistics. They give us an idea about: Where the centre of the distribution is

T he interquartile range, the range and the mode
E N D
Presentation Transcript
SUMMARY STATISTICS • After displaying data using a histogram or stem plot, we can make even more sense of the data by calculating what are called summary statistics. They give us an idea about: • Where the centre of the distribution is • How the distribution is spread out.
5 Summary Statistics • Median • Interquartile range • Range • Mode • Median (this will be looked at later)
The Median • The median is the midpoint of a set of data. • Half the data are less than or equal to the median • We can use the rule : where ‘n’ is the no. of observations. This will tell us the POSITION of the median. • Eg: 2, 5, 6, 8, 11, 12, 15 -How many observations? -Is it in order??? Ans: median = 7 + 8 /2 = 7.5
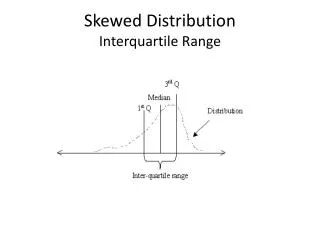
The Interquartile Range • This divides a set of data into quarters. This is referred to as “Quartiles”. • The symbols used to refer to these quartiles are Q1, Q2, Q3. • Q2= median • The interquartile range IQR= Q3 – Q1 • The IQR gives us the range of the middle 50% of values in a set of data.
IQR = Q3- Q1 • Step 1: Write down the data in ordered form from lowest to highest • Step 2: Locate the median; that is, locate Q2. • Step 3: Now consider just the lower half of the set of data. Find the middle score. This score is Q1. • Step 4: Now consider just the upper half of the set of data. Find the middle score. This score is Q3. The four cases given in the next slide illustrate this method.
The range • The range of a set of data is the difference between the highest and lowest values in that set. • You can use the calc: minX and maxX • Range= maximum-minimum
The mode • Most occurring/often score. • If there is more than one score with the highest frequency, then all scores with that frequency are the modes. • The mode is a weak measure of the center of data because it may be a value that is close to the extremes of the data. • Look at the previous slide!
Classwork/Homework • Ex 1E pg 22 Q’s 1-8