Toolkit for Event Analysis and Logging Education
This toolkit, released in July 2012, provides a robust framework for High-Performance Computing (HPC) event analysis. It merges lessons learned from BlueGene ELA and Federation ELA, addressing new requirements while supporting real-time and historical analysis. Key features include a combined event repository, flexible alert delivery mechanisms, and a rules-based engine for alert creation. The toolkit supports various programming languages and integrates with numerous systems for effective monitoring and incident resolution, ensuring proactive management of alerts and events.

Toolkit for Event Analysis and Logging Education
E N D
Presentation Transcript
July 2012 Toolkit for Event Analysis and LoggingEducation
Contents • Overview • Locations • Commands • Alerts and Connectors • Debug • References
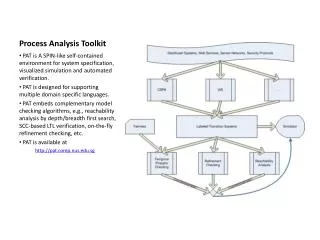
Overview • Common HPC Event Analysis Framework • Combined best aspects and lessons learned from BlueGene ELA and Federation ELA • Addressed new p7 IH requirements • Common Event Repository • First release: CNM, Service Focal Point (HMC), PNSD, LL, GPFS • Analysis of Events to create Alerts • Rules based engine • Flexible alert delivery. For example, RMC and e-mail • Real-time Analysis and Historic Analysis • Real-time to be pro-active and react immediately to events • Historical allows for deeper debug on-site and off-site • Robust framework to prevent loss of alerts and events • Handles event flooding • Checkpoint/Shutdown/Restart • Open Source (pyteal.sourceforge.net) • Using ODBC • Python, C/C++, and Perl
Detect Monitors Observation RAS Strategy TEAL Analyze Generic Analysis Custom Analysis Centralize Database Event Adapters Alert Generic filters, listeners Custom Data collection Find Data Mining Rules Historical analysis queries Manual Analysis Shouldn’t be manual? Query,e-mail, RMC Resolve As enabled Recommended Actions Auto-Recovery Custom Maintenance package escape Correct Refine Get Data Debug Analyze Behavior Release new rules Fix Framework • Grayed-out boxes are future possibilities
CNM … Connector Connector TEAL Concepts Alert Alert Analyzer Event Analyzer Alert Filters semaphore Monitor Event Alert Listeners Event Log (table in xCat DB) Alert Log (table in xCat DB) teal.conf teal.conf teal.conf
Locations • Points to a specific event location • Can be physical, logical or a mixture of both • Is hierarchical in nature • Simple - one type of item per level • Complex - multiple types of items per level • Operations • Scoping • Validation • Casting (platform specific) • XML-based description • /opt/teal/data/ibm/teal/xml/percs_location.xml • Can use it to remind yourself of the location formats
Location Code Examples FR • Complex • Compact ID • Optional Instance Values • Simple • Hierarchy innate in description CG SN DR Example: Example: <node>-<program>-<pid> comp01-firefox-1234 comp01-vncserver-4567 HB LL OM HF LR LD RM H:FR008-CG03-SN000-DR0
Locations • Application • A:c250mgrs20-pvt.ppd.pok.ibm.com##teal.py##28327 • Expect this from PNSD and GPFS – apps in general • Job • J:z25c4s9.ppd.pok.ibm.com.1.3 • Expect this from LoadLeveler • Hardware (aka logical hardware) • H:FR008-CG03-SN000-DR0-HB1-OM27-LR22 • Expect this from ISNM • pSeries (aka service/physical) • P:U9125.F2C.0286C66 • Expect this from SFP • Device • D:c445f1n05 • Can also include device # and minor # if applicable • Expect from UFM and SNMP events • GPFS • C:S1A.ppd.pok.ibm.com|RG:992005VTOP|DA:DA4|PD:c083d4 • Expect from GPFS • UFM • S:default|SW:c445ibsw1-5ec1b8|P:16 • Expect from UFM
Usage • Output is to an alert database • Monitored by the administrator and operators • Various methods of monitoring will be described • Commands are used to query the database • Primary users are the administrator and operator • Runs on the EMS • Commands are issued via the EMS command line • SSRs may run commands under engineering direction • Event database may be collected to work on new analysis algorithms, or bugs
First Things tllsalert • Display all active alerts • Gives a quick snapshot of the issues to dig deeper • Only first occurrence (Primary) alerts are displayed • Subsequent (Duplicate) alerts are not displayed by default • Closed alerts are not displayed by default • What is a Duplicate? • Same Alert Id • Same Location • Same or Lower Urgency • Same or Lower Severity
Digging Deeper tllsalert –f text –q<query string> (-x/-w) • Shows • Reason – why this alert was created • Recommendation – what to do to to repair the problem • Severity • Fatal • Error • Warning • Info • Urgency • Immediate • Schedule • Normal • Defer • Optional • Also Record Id, Alert Id, Event Location, Creation Time, Analyzer Name • -x shows record id of primary alert, if current alert is a duplicate • -w shows record ids of alerts and events associated with the alert
tllsalert Query Options • rec_id (=) A single id or a comma-separated list of ids • alert_id (=) A single id or a comma-separated list of ids • creation_time (=,<.>,>=,<=) A time value in the format YYYY-MM-DD-HH:MM:SS • Specify more general date/times for easy ranges • Specify multiples to create more specific ranges • severity (=) The severity level, listed in order of severity:(F=fatal, E=error, W=warning, I=info) • urgency (=) The urgency of the alert, listed in order of urgency:(I=immediate, S=schedule, N=normal, D=defer, O=optional) • event_loc (=) A location in the format <location type>:<location> • event_scope (=) A scoping value for the specified reporting location type • src_name (=) A single value or a comma-separated list of values
Example query strings • Show all alerts scoped to a higher level in location hierarchyevent_loc=H:FR006-CG10-SN004-DR3-HB3-OM13-LD13 event_scope=drawer • Show all alerts with a specific type of location – good if you know how different event analyzers report locationsevent_loc=U • Show all alerts in a given time rangecreation_time=2012-07creation_time>=2012-07-07-10:30 creation_time<=2012-07-07-10:45
Other tllsalert options • -d • Shows duplicate alerts as well as primary alerts. • Allows you to see how often an alert is occurring and/or most recent occurrences • -c • Show only closed alerts • Without –d only shows primary alerts • -a • Show all open and closed alerts • Without –d only shows primary alerts • -f <output options> • csv: comma separated values – good for spreadsheets • json: javascript object notation - keyword/value pairs • text: full display • brief: default with minimal output
What next? tlchalert –s close –i<rec_id> | –q<query string> • Take recommended actions • If actions did not fix problem, may need to report back to IBM for analysis and updates to any rules creating alert • Close the Alert • By record id – single alert can be closed. May get error messages if close fails, e.g. trying to close a duplicate • By query string • Fields: alert_id, creation_time, severity, urgency, event_loc, event_scope, src_name • Can close multiples – by creation time or location (with or without scope) typically • Dangerous! May inadvertently close an alert before action taken. Currently no option to reopen alert • Future enhancement to allow message to be added by admin on close • See http://sourceforge.net/apps/mediawiki/pyteal/index.php?title=Using for other examples
Managing Events • Listing events • tllsevent • tllsevent -q”src_loc=H:FR007-CG03-SN016-DR0-HB0 src_scope=hub” • tllsevent –e –f text • tllsevent –q”time_logged=2011-04” • Removing Events • tlrmevent --older-than 2011-01-01-12:00:00 • Only Events not associated with: • an alert • a checkpoint
Cleaning Out the DB • Close (by resolving) any active alerts (tlchalert) • Remove all closed alerts (tlrmalert -–older-than) • Remove all events not associated with an alert (tlrmevent -–older-than)
Checkpoints tllschkpt CnmEventAnalyzer R 35301 PNSDEventAnalyzer R None LLEventAnalyzer S None SFPEventAnalyzer R None monitor_event_queue R 35301 MAX_event_rec_id 35301 tllschkpt –f text <- shows additional data • monitor_event_queue is last recovery type and start rec_id • GEAR based analyzers contain pool checkpoint information State when analyzer last checkpointed Last event processed by the monitor Maximum rec_id in event log
Historic Analysis - Reanalyzing • User can set up a query for the criteria of interest • Filters and listeners in the configuration file for historic mode or all modes are executed • Choice of committing or not committing (default) the generated alerts • To capture all alerts produced, a file or print listener that does not specify any filters should be used • Time occurred or time logged can be used for analysis teal --historic -–query=”src_comp=CNM time_occurred>2011-02-01-10:00:00”
TEAL historic and tllsevent Options • rec_id (=,<,>,<=,>=) Can be a single value or a comma separated list of ids • event_id (=) Can be a single value or a comma-separated list of ids • time_occurred (=,<,>,<=,>=) A single value in the format of yyyy-mm-dd hh:mm:ss • time_logged (=,<,>,<=,>=) A single value in the format of yyyy-mm-dd hh:mm:ss • src_comp (=) Can be a single value or a comma-separated list of values • src_loc_type:src_loc (=) The location is optional otherwise all events with the same location type will be included. • src_scope (=) Level to scope all source locations to. This is only valid if the reporting location type is specified • rpt_comp (=) Can be a single value or a comma-separated list of values • rpt_loc_type:rpt_loc (=) The location is optional otherwise all events with the same location type will be included • rpt_scope (=) Level to scope all reporting locations to. This is only valid if the reporting
Sample output – csv and json • csv – good for reading into spreadsheets, or program parsing rec_id,event_id,time_occurred,time_logged,src_comp,src_loc,src_loc_type,rpt_comp,rpt_loc,rpt_loc_type,event_cnt,elapsed_time 91455,BD700041,2011-02-09 15:06:19,2011-02-09 15:06:19,CNM,BB03-FR007-SN000-DR0-HB0-LD00,H,CNM,"TRMD",A,, • json– good for program parsing {"src_comp": "CNM", "rpt_loc_type": "A", "event_id": "BD700041", "src_loc_type": "H", "time_occurred": "2011-02-09 15:06:19", "rec_id": 91455, "event_cnt": null, "rpt_loc": "TRMD", "elapsed_time": null, "rpt_comp": "CNM", "time_logged": "2011-02-09 15:06:19", "src_loc": "BB03-FR007-SN000-DR0-HB0-LD00“}
Node Infiniband Switch Unified FabricManager iDataplex • Trap handlers depend on xCAT for SNMP setup BMC IPMI Trap Handler TEAL Event Log TEAL Switch Trap Handler UFM Trap Handler UFM Monitor Polling
BMC/AMM SNMP Support Drawer EMS TEAL BMC 7 6 TEAL IPMI Trap Handler 5 Event Log AMM 4 3 monsetting Blade 1 xCAT SNMP 2 • Simple rules based on severity levels • xCAT setup and routing • SNMP event triggers • Mainly chassis related failures – power, processor, temperature, etc…
BMC Event =================================================== rec_id : 24092 event_id : II086F01 - Power Supply Failure detected time_occurred : 2012-06-20 11:58:21 time_logged : 2012-06-20 07:39:05 src_comp : IPMI src_loc : c445f1n01 src_loc_type : D rpt_comp : TEAL rpt_loc : c445ems1##tlipmitraphandler.py##20897 rpt_loc_type : A event_cnt : None elapsed_time : None ext.entity : 0 ext.entity_inst : 1 ext.event_data1 : 1 ext.event_data2 : 255 ext.event_data3 : 255 ext.event_data4 : 0 ext.event_data5 : 0 ext.event_data6 : 0 ext.event_data7 : 0 ext.event_data8 : 0 ext.event_src : 32 ext.guid : EA145C04074D11E18BCE5CF3FC3048A6 ext.lang_code : 25 ext.message : CRITICAL: Power Supply, Power Supply Failure Detected (Sensor 0x72) ext.mfg_id : 20301 ext.sensor_dev : 129 ext.sensor_num : 114 ext.sequence : 544 ext.severity : 16 ext.sys_id : 353 ext.time_occurred : 456580701 ext.trap_src : 32 ext.utc_offset : -1 Compute Node Location Platform Event Trap (PET) decimal data
BMC Alert =================================================== rec_id : 1803 alert_id : II086F01 creation_time : 2012-06-20 07:39:15 severity : E urgency : N event_loc : c445f1n01 event_loc_type : D fru_loc : None recommendation : Refer to vendor documentation for appropriate repair actions reason : CRITICAL: Power Supply, Power Supply Failure Detected (Sensor 0x72) src_name : MMEventAnalyzer state : 1 raw_data : {"utc_offset":"-1","sequence":"544","event_data4":"0","time_occurred":"456580701","trap_src":"32","entity":"0","mfg_id":"20301","event_data8":"0","lang_code":"25","event_data6":"0","event_data7":"0","message":"CRITICAL: Power Supply, Power Supply Failure Detected (Sensor 0x72)","guid":"EA145C04074D11E18BCE5CF3FC3048A6","event_data2":"255","event_src":"32","event_data1":"1","sensor_num":"114","event_data5":"0","severity":"16","entity_inst":"1","raw_data":"None","event_data3":"255","sys_id":"353","sensor_dev":"129"}
Infiniband/UFM • Beta release • Mellanox only • UFM 3.7.1 • Simple event analysis and alert reporting.
UFM Locations Site Computer Switch Computer Port Switch Port Line Spine PSU Fan SMB Line Port Spine Port
UFM Event =================================================== rec_id : 22744 event_id : MX050110 - Symbol-Error counter threshold was exceeded time_occurred : 2012-06-07 13:15:10 time_logged : 2012-06-07 13:15:13 src_comp : IB src_loc : S:default|SW:c445ibsw1-5ec1b8|P:5 src_loc_type : U rpt_comp : TEAL rpt_loc : c445hsm1 rpt_loc_type : A event_cnt : None elapsed_time : None ext.category : Hardware ext.description : Symbol-Error counter rate threshold exceeded. Threshold is 200, received value is 205. ext.severity : WARNING UFM Server
UFM Alert =================================================== rec_id : 1577 alert_id : MX050110 creation_time : 2012-06-07 06:21:15 severity : W urgency : N event_loc : S:default|SW:c445ibsw1-5ec1b8|P:16 event_loc_type : U fru_loc : None recommendation : Record the alert ID and message. Contact IBM Service. Call your next level of support. reason : Symbol-Error counter threshold was exceeded src_name : IBEventAnalyzer state : 1 raw_data : None * Working with vendor to enhance rules and recommendations
P7-IH HMC HMC HMC Service Focal Point CNMD CNM Alerts CNM TEAL Event Log TEAL GPFS Collector GPFS GPFS GPFS • PNSD and Service Focal Point rely on RSCT/RMC for communication • Loadlever is polling interface • GPFS requires connector for each GPFS cluster • CNM reports alerts to the HMC for IBM service through TEAL Loadleveler RAS Log Loadleveler PNSD Compute Node
FSP FSP FSP EMS CNM and TEAL SFP TEAL Listener Filter Network Events ISNM/CNM Analyzer Init Monitor Rules NM Event Alert 37
Network Hardware Events Events reported by the HFI, ISR or Optical Module: HFI Events HFI Down – report for completeness of network status Link Events Link types are HFI-to-ISR links, Llocal (intra-drawer), Lremote (intra-SN), and D-link (inter-SN) Port Down/Port Up Threshold events: CRC, dropped flit, flit retry Correctable/uncorrectable errors on port-level routing structures Packet flow events, e.g. credit overflow, sender hang informational Optical Module Events Module-level events affect a single D port or two LR ports Channel-level events affect a single D port. May affect one or two LR ports depending on which channels are affected. Some OM events are thresholded by LNMC 38
Frame Events Reported directly to CNM by frame (BPA) firmware ISNM uses these events for analysis only – BPA creates any serviceable events for the problems it detects; ie. it suppresses network events caused by frame events Sample frame events that may affect the ISR network: CEC power dropped due to MCM Over Temperature CEC DCCA errors High ambient temperature BPA CNM FSP FSP FSP FSP 39
Example CNM Alert >[c250mgrs52]>/opt/teal/bin/tllsalert -f text -q "alert_id=BD700025” rec_id : 9673 alert_id : BD700025 creation_time : 2011-08-16 15:15:11.146044 severity : E urgency : S event_loc : FR052-CG03-SN000-DR0-HB1-OM12-LD12 event_loc_type : H fru_loc : None recommendation : There is a problem with a D-Link. Record the alert ID. Record the location in the alert message. Contact IBM Service. Log on to the Management Server. To isolate to the proper FRU, run Link Diags and perform the actions that it recommends. If no action is recommended, because Diags cannot isolate to the proper FRU, replace the FRUs in the order listed. reason : D-link down between frame FR052 cage CG03 (superNode SN000 drawer DR0) hub HB1 port LD12 and frame FR052 cage CG06 (superNode SN003 drawer DR0) hub HB1 port LD15 (D Link Port Down) src_name : CnmEventAnalyzer state : 1 raw_data :{"fru_list":"{ HFI_DDG,Isolation Procedure,,,, },{ HFI_CAB,Symbolic Procedure,U78A9.001.20C1000-P1-T17-T6,,, },{ CBLCONT,Symbolic Procedure,U78A9.001.311B001-P1-T16-T5,,, },{ 52Y3020,FRU,U78A9.001.20C1000-P1-R2,YA193P203586,ABC123,TRMD },{ 52Y3020,FRU,U78A9.001.311B001-P1-R2,YA193P399669,ABC123,TRMD }","nbr_loc":"FR052-CG06-SN003-DR0-HB1-OM15-LD15","nbr_typ":"H","pwr_enc":"78AC-100BC50052","eed_loc":"c250mgrs52:/var/opt/isnm/cnm/log","encl_mtms":"9125-F2C/028B506"} 40
CNM FRU list format in alerts raw_data :{"fru_list":"{ HFI_DDG,Isolation Procedure,,,, },{ HFI_CAB,Symbolic Procedure,U78A9.001.20C1000-P1-T17-T6,,, },{ CBLCONT,Symbolic Procedure,U78A9.001.311B001-P1-T16-T5,,, },{ 52Y3020,FRU,U78A9.001.20C1000-P1-R2,YA193P203586,ABC123,TRMD },{ 52Y3020,FRU,U78A9.001.311B001-P1-R2,YA193P399669,ABC123,TRMD }","nbr_loc":"FR052-CG06-SN003-DR0-HB1-OM15-LD15","nbr_typ":"H","pwr_enc":"78AC-100BC50052","eed_loc":"c250mgrs52:/var/opt/isnm/cnm/log","encl_mtms":"9125-F2C/028B506"} • Multiple FRUs with each one contained in braces • Part number, FRU type, FRU location, ECID, CCIN
Example CNM Compound Alert >[c250mgrs52]>/opt/teal/bin/tllsalert -f text -q "alert_id=BDFF0060” -w rec_id : 13304 alert_id : BDFF0060 creation_time : 2011-08-26 19:02:53.971854 severity : W urgency : O event_loc : FR052-CG04-SN001-DR0 event_loc_type : H fru_loc : None recommendation : A large number of HFI network links attached to a drawer are down without an accompanying power event. Contact IBM Service and report the alert ID. If a drawer lost power, then this is a secondary effect. reason :Drawer level event occurred on frame FR052 cage CG04 (superNode SN001 drawer DR0). (Suspicious Drawer) src_name : CnmEventAnalyzer state : 1 raw_data : {"fru_list":"{ HFI_IDR,Isolation Procedure,,,, }","nbr_loc":"FR052-CG04-SN001-DR0-HB7-OM09-LD09","nbr_typ":"H","pwr_enc":"78AC-100BC50052","eed_loc":"c250mgrs52:/var/opt/isnm/cnm/log","encl_mtms":"9125-F2C/028B5D6"} Condition Alerts: [] Condition Events: [32873,32874,32875,32876,32877,32878,32879,32880,32881,32882,32883,32884] Duplicate Alerts: [] Suppression Alerts: [] Suppression Events: [] 42
Example CNM Alert with suppression >[c250mgrs52]>/opt/teal/bin/tllsalert -f text -q "alert_id=BD700022” -w rec_id : 8507 alert_id : BD700022 creation_time : 2011-08-11 14:39:00.244292 severity : E urgency : S event_loc : FR052-CG10-SN007-DR0-HB3-OM09-LD09 event_loc_type : H fru_loc : None recommendation : There is a problem with a D-Link. Record the alert ID and call IBM Service. Log on to the Management Server. To isolate to the proper FRU, run Link Diags and perform the actions that it recommends. If no action is recommended, because Diags cannot isolate to the proper FRU, replace the FRUs in the order listed. reason : D Link Port Lane Width Change between frame FR052 cage CG10 (superNode SN007 drawer DR0) hub HB3 port LD09 and frame FR052 cage CG09 (superNode SN006 drawer DR0) hub HB3 port LD08 (D Link Port Lane Width Change) src_name : CnmEventAnalyzer state : 1 raw_data : {"fru_list":"{ HFI_DDG,Isolation Procedure,,,, },{ HFI_CAB,Symbolic Procedure,U78A9.001.30CK001-P1-T14-T1,,, },{ CBLCONT,Symbolic Procedure,U78A9.001.312N005-P1-T14-T2,,, },{ 52Y3020,FRU,U78A9.001.30CK001-P1-R5,YA193P400322,ABC123,TRMD },{ 52Y3020,FRU,U78A9.001.312N005-P1-R5,YA193N035309,ABC123,TRMD }","nbr_loc":"FR052-CG09-SN006-DR0-HB3-OM08-LD08","nbr_typ":"H","pwr_enc":"78AC-100BC50052","eed_loc":"c250mgrs52:/var/opt/isnm/cnm/log","encl_mtms":"9125-F2C/028B5F6"} Condition Alerts: [] Condition Events: [26388] Duplicate Alerts: [8511] Suppression Alerts: [] Suppression Events: [26389,26390] 43
Example CNM Event >[c250mgrs52]>/opt/teal/bin/tllsevent -f text -q “event_id=BD700025” -e rec_id : 22877 event_id : BD700025 - D Link Port Down time_occurred : 2011-08-01 14:52:14 time_logged : 2011-08-01 14:52:14.369687 src_comp : CNM src_loc : FR052-CG07-SN004-DR0-HB0-OM14-LD14 src_loc_type : H rpt_comp : CNM rpt_loc : c250mgrs52##cnmd rpt_loc_type : A event_cnt : None elapsed_time : None ext.eed_loc_info : c250mgrs52:/var/opt/isnm/cnm/log ext.encl_mtms : 9125-F2C/028B596 ext.global_counter : None ext.isnm_raw_data : REG_BEGIN ISR_GLOBAL_COUNTER_REGISTER = 0x000005347ecda480 ISR_ID_REGISTER = 0x004800d01c000000 ISR_D14D15_FIR = 0x4000000000000000 D_PORT_14_SEND_NEIGHBOR_ID = 0x000800d01ee00000 OLL_LLD14_LINK_STATUS = 0xc1d6000100000000 REG_END ext.local_om1 : U78A9.001.30CM002-P1-R2-R1,52Y3020,YA193P407777,ABC122,TRMD ext.local_om2 : ext.local_planar : U78A9.001.30CM002-P1,74Y0601,YH10HA0BH002,ABC122,2E00 ext.local_port : U78A9.001.30CM002-P1-T17-T7 ext.local_torrent : U78A9.001.30CM002-P1-R2,52Y3020,YA193P407777,ABC123,TRMD ext.nbr_om1 : U78A9.001.30CK001-P1-R2-R4,52Y3020,YA193P399201,ABC123,TRMD ext.nbr_om2 : ext.nbr_planar : U78A9.001.30CK001-P1,74Y0601,YH10HA0BJ003,ABC123,2E00 ext.nbr_port : U78A9.001.30CK001-P1-T15-T8 ext.nbr_torrent : U78A9.001.30CK001-P1-R2,52Y3020,YA193P399201,ABC123,TRMD ext.neighbor_loc : H: FR052-CG04-SN006-DR0-HB0-OM11-LD11 ext.pwr_ctrl_mtms : 78AC-100BC50052 ext.recovery_file_path : /var/opt/isnm/cnm/log 44
SFP Connector FSP TEAL HMC • Uses RMC and xCAT monitoring support • Retrieves batches of events from HMC HMCs Configured [c250mgrs14][/]> nodels hmc c250hmc05_a RMC set up [c250mgrs14][/]> lscondresp Displaying condition with response information: Condition Response Node State "AllServiceableEvents_HB" "TealLogSfpEvent_HB" "c250mgrs14" "Active"
SFP Event rec_id : 8490 event_id : B1812A80 time_occurred : 2011-04-20 09:57:41 time_logged : 2011-04-20 09:58:46.187401 src_comp : SFP src_loc : U9125.F2C.P7IH165 src_loc_type : P rpt_comp : 7042CR5/KQZAAAT rpt_loc : c250hmc05.ppd.pok.ibm.com##AllServiceableEvents_B rpt_loc_type : A event_cnt : None elapsed_time : None ext.call_home : N ext.description : Platform firmware (0x81) reported an error. ext.fru_list : [['FSPSP04', 'ACT04219I Isolate procedure', '', '', '', ''], ['45D7208', 'ACT04216I FRU', 'U78A9.001.1122233-P1-R5', 'YH30HA022005', '', '2A3A'], ['FSPSP06', 'ACT04219I Isolate procedure', '', '', '', '']] ext.prob_num : 320 ext.sfp_raw_data : {'FRURecentlyReplaced': ['No', 'No', 'No'], 'FRULogicControllingCECMachineSerialNumber': ['P7IH165', 'P7IH165', 'P7IH165'], 'HSCBiosName': 'KQZAAAT', 'CreatedTimeStamp': '04/20/2011 06:16:49', 'CECMachineModel': 'F2C', 'FDAdditionalMachine': ['9125-F2C-P7IH165'], 'EventType': 'open', 'SystemRefCode': 'B1812A80', 'CreatorID': 'E', 'FRUEnclosureMachineSerialNumber': ['P7IH165', 'P7IH165', 'P7IH165'], 'FRUEnclosureMachineTypeModel': ['9125-F2C', '9125-F2C', '9125-F2C'], 'DuplicateCount': '0', 'EventSeverity': '32', 'CECMachineType': '9125', 'SubsystemID': '129', 'FRULogicControllingCECMachineTypeModel': ['9125-F2C', '9125-F2C', '9125-F2C'], 'CalledHome': 'No', 'FRUReplacementPriority': ['80', '50', '25'], 'CECMachineSerialNumber': 'P7IH165', 'LastReportedTimeStamp': '04/20/2011 06:16:49', 'HSCBiosId': '7042CR5', 'PlatformLogID': '1346333000'} Failing MTMS Reporting HMC FRU List Problem # on HMC
SFP Alert rec_id : 8040 alert_id : 14020079 creation_time : 2011-05-17 12:58:58.661058 severity : E urgency : N event_loc : U9458.100.BPCF007 event_loc_type : P fru_loc : None recommendation : reason : Power/Cooling subsystem & control (0x60) reported an error. src_name : SFPEventAnalyzer state : 1 raw_data : {'FRU List': [['IQYRISC', 'ACT04219I Isolate procedure', '', '', '', ''], ['PU_BOOK', 'ACT04216I FRU', 'U78A9.001.1122233', '', '', '']], 'SFP': 'c250hmc05.ppd.pok.ibm.com', 'Problem Number': 601}
SFP FRU list format in alerts raw_data : {'FRU List': [['IQYRISC', 'ACT04219I Isolate procedure', '', '', '', ''], ['PU_BOOK', 'ACT04216I FRU', 'U78A9.001.1122233', '', '', '']], 'SFP': 'c250hmc05.ppd.pok.ibm.com', 'Problem Number': 601} • Multiple FRUs with each one contained in brackets • Part number, FRU type, FRU location, ECID, CCIN
GPFS Connector Compute Service TEAL GPFS I/O • Mount/unmount filesystem • Add/Change/Delete Disk • Storage Group Manager Takeover • Node Recovery/Failure • Filesystem Creation/Change/Deletion • Event Collection Buffer Overflow • Hung Thread • Storage Pool Utilization • Console Log • Long I/O Time • Recovery Group Takeover/Relinquish • Recovery Group Open Failed • Recovery Group Panic • pdisk Failed/Recovered • pdisk Replace pdisk • pdisk Path Failed • Declustered Array Rebuild Failed • NSD Checksum Mismatch GPFS Cluster Utility • Service node must be in GPFS cluster • Must have GPFS RPMs installed • At least one service node per GPFS cluster. • Secondary can be backup • Service node runs GPFS connector via GPFS collector capabilities • Uses RMC for event notification and connector monitoring • Only logs events – no alerts generated • Provides some basic GPFS subsystem health
GPFS Locations Cluster Recovery Group Node Disk (NSD) Filesystem Declustered array Storage Pool Fileset pdisk vdisk