Download
1 / 17
170 likes | 328 Vues
The 2007 Triennial Salary Survey, conducted by leading toxicological organizations, collected data from 3,424 respondents representing a combined membership of over 10,000 professionals. Notably, 95.6% of respondents were employed at the year-end. Among those unemployed, 52% were retired, while 55% of the non-retired were unemployed for less than a year. The survey highlighted the demographics, employment sectors, and salary ranges in toxicology, revealing that 85.6% were full-time salaried employees. Insights into certifications and job-related aspects were also included.

E N D
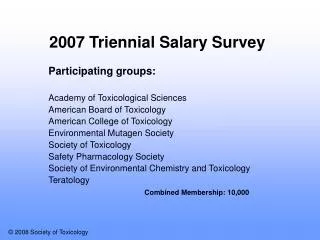
2007 Triennial Salary Survey Participating groups: Academy of Toxicological Sciences American Board of Toxicology American College of Toxicology Environmental Mutagen Society Society of Toxicology Safety Pharmacology Society Society of Environmental Chemistry and Toxicology Teratology Combined Membership: 10,000
3,424 Respondents • 95.6% were employed at the end of 2007 • of those not working, 52% were retired • of those who were unemployed (not retired) 55% had been unemployed less than a year 25% had been unemployed for over 5 years
Employment category for respondents Employed full-time (salaried employee) 85.6% Self-employed full-time (owner or principal) 4.0% Postdoctoral fellow 2.9% Graduate student (full time) 2.7% Employed part-time (salaried employee) 2.0% Self-employed part-time (owner or principal)1.8% Other 1.0%
Geographical Distribution of U.S. Toxicologists Source: 2007 Triennial Toxicology Survey
Board Certification No certifications 63% Have certifications 37% DABT 31.9% ATS 2.2% ACVP 1.1% ERT 1.0% RPh 1.0% DACVP 0.7% DABVT 0.7% ABVT 0.5% MRC Path 0.2% FRC Path 0.2% ACLAM 0.2%
Salary Range in Toxicology by Degree 53% also receive a bonus, commission, stock gift, or profit-sharing from main job