Download
1 / 20
200 likes | 351 Vues
District Special Education Plan 2009-2011 . Bethlehem Central School District September 16, 2009. District Special Education Plan Requirements – 2 year. Description of scope of special education services available Data on students served

E N D
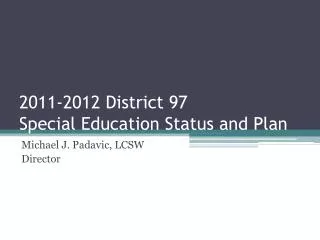
District Special Education Plan 2009-2011 Bethlehem Central School District September 16, 2009
District Special Education PlanRequirements – 2 year • Description of scope of special education services available • Data on students served • Methods used to evaluate program objectives – Student Results • Selected policies and practices • Estimated budget
BC Special Education Goals • Build district capacity to serve our students in our district – reduce out-of-district placements • Provide high quality, cost effective services that improve outcomes • Increase district capacity to support interventions for struggling students to avoid inappropriate referrals to special education • Develop a continuum of services that is based on learner strengths and needs • Embrace 21st Century Learning
62 students placed out of district • 26 more at-risk of such placement • Average cost per student $45,000 • Graduation rate 33% • Classification rate of 10.9% • Declassification rate at 4% • Limited supports available in general education Where were we in 2004?
114 more students with disabilities were identified or moved into the district (19.6% increase). 33 more students needed 504 plans (73% increase) 19 more students were placed in BOCES programs (52% increase). 23 more students were at risk of being placed out of district Where were we in 2004?
Discussion… We were facing a $2.5 million dollar shortfall in 2004 school year. How would we go forward?
Fiscal State of Health… What was our vision for special education in our district? How did our long term program goals align with our fiscal planning? Were there places to redirect or save funds? Where could we reinvestsavings, if any, to increase support for general education students who were struggling, avoid inappropriate referrals to special education and improve results?
Use of Funding • Increased student supports (SW, behavior specialists, psychiatrists, autism expertise) • Increase funding spent on embedded professional development – Develop our own internal consultants • TCI • Literacy Initiatives • Behavior Specialists • Assistive Technology • Co-Teaching (40 teams K-12)
BC Special Education Continuum High School Social Development Class (8:1:2) Social Communication Class Life Skills Program Functional and Life Skills Program Social Development Class (8:1:2) Social Communication Class (8:1:2) Middle School Intensive Skills Class (9:1:4) Social Development Class (8:1:3) Intermediate Skills Class (12:1:2) Grades 3-5 Primary Skills Class (12:1:2) Primary Skills Class (12:1:2) Grades K – 2 Special Class (K) (12:1:2) + co-teach) Primary Skills Class (12:1:2) Intensive Skills Class (6:1:4)
Reducing Costs • 2005-07 Savings……................$1.4 Million • 2007-08 Projected Savings………$327,000 • Budget Amendment…………..…$1.1 Million • 2008-09…………………….. Within Budget • 2009-10……………………..On Track
Where are we now in 2009? • 8 students placed out of district in BOCES and 25 in private schools • Over 30 students returned to district successfully • Placement in separate settings out-of-district has declined from 7% to less than 1% • Graduation rate 73% • Classification rate of 11.2 – holding steady • Declassification rate 11% (4 times statewide ave.) • Increased supports for general education students
Summary: Academic Performance for Students with Disabilities • District in Good Standing • Exceeds State performance indicators for graduation rate, drop out rate, transition • ELA and Math, (4 and 8) BC scoring above state objectives for students with disabilities and data for all students (general education and special education students combined)
Performance on State ELA Assessments 1999-2008
Summary: Academic Performance • Declassification rate far exceeds state rate. 11% vs. 4%. • Parent satisfaction 98.5% • Classification rate holding steady at 11.08 • Increased numbers of students taking Regents exams (62 in 2001-02 to 159 in 2007-08) • Student performance on secondary math exams far exceeds State expectations
Summary: Academic Performance for Students with Disabilities • Performance on Grade 5 math assessment increased 53% to 83% (levels 3 and 4) in 3 years • Performance on Grade 8 ELA improved from 11% to 26% (levels 3 and 4) • Performance on Grade 4 ELA improved from 44% to 56% (levels 3 and 4)
Development of Inclusion Model – K-12 Continue implementing Research-based special education programs based on learner characteristics Fully Implement Response to Intervention Align technology with 21st Century learning Continuing the Momentum
District Special Education Plan 2009-2011 Bethlehem Central School District September 16, 2009