Efficient Retrieval of Time-Series Patterns from Databases
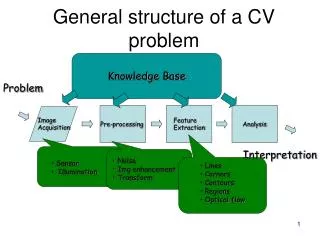
This work addresses the retrieval of time-series data similar to a specified pattern, such as stock charts and electrocardiograms. It discusses the challenges of indexing and retrieval, focusing on methods that allow for inexact matches and handle missing data. Previous methods are reviewed, including feature selection, similarity metrics, and advanced indexing techniques. Empirical results highlight the effectiveness of using prominent features for retrieval. The proposed algorithms aim to enhance the efficiency and accuracy of matching time-series patterns.

Efficient Retrieval of Time-Series Patterns from Databases
E N D
Presentation Transcript
General problem Retrieval of time-series similar to a givenpattern.
Example: Stock charts Database of time-series
Example: Stock charts Database of time-series Pattern
Example: Stock charts Database of time-series Pattern Retrieval results
Example: Stock charts Database of time-series Pattern Retrieval results .92 .87 .86 .84
Example: Electrocardiogram Database of time-series
Example: Electrocardiogram Database of time-series Pattern
Example: Electrocardiogram Database of time-series Pattern Retrieval results .91 .87 .98 1.0
Outline • Previous work • Important points • Indexing and retrieval • Empirical results • Conclusions
Outline • Previous work • Important points • Indexing and retrieval • Empirical results • Conclusions } Contributions
Criteria for retrieval methods Gunopulos [2000]: • Work for erratic time-series • Accept any pattern • Find inexact matches • Work when some points are missing • Work on streaming data
Outline • Previous work • Important points • Indexing and retrieval • Empirical results • Conclusions
Previous work • Feature choice • Similarity metrics • Indexing and retrieval
Previous work: Feature choice • Discrete Fourier transforms • Alphabets • Statistical features • Subsets of points
Previous work: Similarity metrics • Euclidean distance • Bounding rectangles • Envelope count • Aggregate similarity
Previous work: Indexing and retrieval • Advanced techniques: • B-trees • R-trees • KD-trees • VP-trees • Grids • Applied techniques: • Linear search with compression
Outline • Previous work • Important points • Indexing and retrieval • Empirical results • Conclusions
Important points Choose “important” maxima and minima, and discard the other points.
Important points Choose “important” maxima and minima, and discard the other points. Example: Original series
Important points Choose “important” maxima and minima, and discard the other points. Example: Original series
Important points Choose “important” maxima and minima, and discard the other points. Example: Compressed series Original series
Definition of important points Important minimum
Definition of important points Important minimum • am is the minimum among ai,…, aj
Definition of important points Important minimum • am is the minimum among ai,…, aj • ai/am R andaj/am R
Definition of important points Important minimum • am is the minimum among ai,…, aj • ai/am R andaj/am R • R is a knob that determines compression rate
Definition of important points Important maximum • am is the maximum among ai,…, aj • am/ai R andam/aj R • R is a knob that determines compression rate
Compression example Originalseries
Compression example Originalseries Compressed series
Compression example Originalseries Compressed series
Compression example Originalseries Compressed series
Compression algorithm • Linear time • Constant memory • Accepts streaming data • For a series with n values, compression time is 0.0133 n milliseconds (300 MHz PC, Visual Basic 6.0).
Outline • Previous work • Important points • Indexing and retrieval • Empirical results • Conclusions
Retrieval • Retrieval of time-series similar to a given pattern. • Intuition: • Find a prominent feature in the pattern • Find candidate segments with a similar feature • Compare similarity of candidates to the pattern
Example: Stock charts Database of time-series
Example: Stock charts Database of time-series
Example: Stock charts Database of time-series Pattern
Example: Stock charts Database of time-series Pattern
Example: Stock charts Database of time-series Pattern
Example: Stock charts Database of time-series Pattern Retrieval results .92 .87 .86 .84
Algorithm • Identify the prominent leg in the pattern • Retrieve similar legs from the database • Identify corresponding candidate segments • For each candidate segment, compute its similarity to the pattern • Output the candidates whose similarity is above the threshold
Important details • Use compressed pattern and compressed sequences in the retrieval process • The prominent feature is the leg having the greatest ratio of right end to left end • All legs in the database are indexed by their prominence, using a binary search tree
Alternative versions • Different prominence definitions • Different similarity metrics • The end-point ratio prominence usually gives the best empirical results.
Extended legs Similar sequence
Indexing on extended legs • Advantage: More accurate retrieval • Disadvantage: Larger index, more memory • If a compressed sequence has n legs: • Worst case: n2/2 extended legs • Average case: (n lg n) extended legs
Outline • Previous work • Important points • Indexing and retrieval • Empirical results • Conclusions
Data sets • Stock charts • Air and sea temperatures • Wind speeds • Electroencephalograms • Electrocardiograms
Data sets • Stock charts • Air and sea temperatures • Wind speeds • Electroencephalograms • Electrocardiograms 60,000 points 445,000 points 79,000 points 17,000 points 2,000 points
Patterns Compressed patterns with 4 to 27 legs Examples:
Retrieval time Retrieval time: 0.07 m k milliseconds m legs in a pattern k candidates