Linear vs. Exponential:
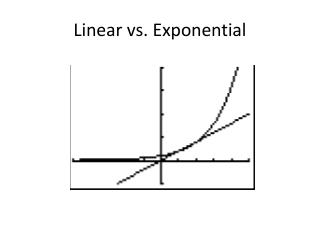
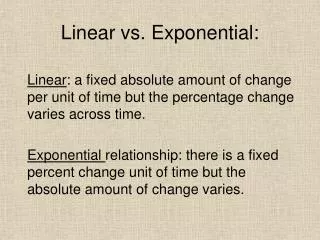
Linear vs. Exponential:. Linear : a fixed absolute amount of change per unit of time but the percentage change varies across time. Exponential relationship: there is a fixed percent change unit of time but the absolute amount of change varies.

Linear vs. Exponential:
E N D
Presentation Transcript
Linear vs. Exponential: Linear: a fixed absolute amount of change per unit of time but the percentage change varies across time. Exponential relationship: there is a fixed percent change unit of time but the absolute amount of change varies.
Two methods for solving exponential growth problems: • Simulation (aka “table method”) • Direct solution using exponential growth formula
Simulation of exponential growth Copy the formula in Row 5 for all necessary time periods.
Demonstration in lab Compute the value of a variable x whose initial value is 100 after growth for 50 time periods at a 4% growth rate.
Direct solution using exponential growth formula:Deriving the formula
Exponential growth is a successive percentage change phenomenon. The percentage change just stays the same.
Successive percents formula: Y = X*(1+p1)*(1+ p2)*(1+ p3)
Change in notation Y = X*(1+r)*(1+ r)*(1+ r) Where r is the percentage rate of change expressed as a proportion.
Two reminders: To convert a percentage into a decimal (proportion), move the decimal point over two places to the left. The plus sign is converted to a negative for percentage decreases.
Deriving the general equation for exponential functions: Y = X*(1+r)
Deriving the general equation for exponential functions: Y = X*(1+r) Y = X*(1+r)(1+r)
Deriving the general equation for exponential functions: Y = X*(1+r) Y = X*(1+r)(1+r) or Y = X*(1+r)2
Deriving the general equation for exponential functions: Y = X*(1+r) Y = X*(1+r)(1+r) Y = X*(1+r)(1+r)(1+r)
Deriving the general equation for exponential functions: Y = X*(1+r) Y = X*(1+r)(1+r) Y = X*(1+r)(1+r)(1+r) or Y = X*(1+r)3
General equation for exponential functions: Y = X*(1+r)t Where: Y is the amount of the variable at any point in time X is the initial amount of X r is the rate of change t is the number of time periods of change in Y
Direct solution using exponential growth formula: Steps in solving for Y: • Y=X*(1+r)t • Substitute known information into equation • Compute • Exponentiation in Excel: ^t • Y=X*(1+r)^t
Between 1970 and 2000, DePaul tuition increased from $1,620 per year to $15,390. The average annual tuition increase was 7.9%.Assuming the same rate of change, what will tuition be in 2010?
Y=$15,390*(1+.079)10 • Y=$15,390*1.07910 • Y=$15,390*2.139018 • Y=$32,919.49
Computing the rate of change (solving for r) • Start with the formula: Y=X*(1+r)t
Computing the rate of change (solving for r) • Start with the formula: Y=X*(1+r)t • Enter the values for Y, X and t
Computing the rate of change (solving for r) • Start with the formula: Y=X*(1+r)t • Enter the values for Y, X and t • Divide Y by X: Y/X = (1+r)t
Computing the rate of change (solving for r) • Start with the formula: Y=X*(1+r)t • Enter the values for Y, X and t • Divide Y by X: Y/X = (1+r)t • Extract the tth root of both sides. • In Excel, roots are extracted by ^(1/t)
Computing the rate of change (solving for r) • Start with the formula: Y=X*(1+r)t • Enter the values for Y, X and t • Divide Y by X: Y/X = (1+r)t • Extract the tth root of both sides. • In Excel, roots are extracted by ^(1/t) • (Y/X)^(1/t)=(1+r)^t^(1/t)
Computing the rate of change (solving for r) • Start with the formula: Y=X*(1+r)t • Enter the values for Y, X and t • Divide Y by X: Y/X = (1+r)t • Extract the tth root of both sides. • In Excel, roots are extracted by ^(1/t) • (Y/X)^(1/t)=(1+r)^t^(1/t) • Extracting the root cancels out the exponentiation of (1+r)t
Computing the rate of change (solving for r) • Start with the formula: Y=X*(1+r)t • Enter the values for Y, X and t • Divide Y by X: Y/X = (1+r)t • Extract the tth root of both sides. • In Excel, roots are extracted by ^(1/t) • (Y/X)^(1/t)=(1+r)^t^(1/t) • Extracting the root cancels out the exponentiation of (1+r)t • (Y/X)^(1/t) = 1+r
Computing the rate of change (solving for r) • Start with the formula: Y=X*(1+r)t • Enter the values for Y, X and t • Divide Y by X: Y/X = (1+r)t • Extract the tth root of Y/X both sides: (Y/X)^(1/t)=1+r • Subtract 1 from the result of step 4 (Y/X)^(1/t)-1 = r
Solving for t • How long will it take for a variable increasing or decreasing exponentially to reach a known or specified value of Y? • To solve requires use of logarithms. . . Jump to logarithms presentation
Linear or exponential? Over a 15 year period, the number of workplace injuries at International Widget Inc. fell by 3 per year.
Linear or exponential? From 1997 through 2005, revenues at Bogus Pictures rose by 7.5% per year.
Linear or exponential?Computational method • For two sets of time periods, compute the absolute change from one time period to the next. If it is the same, the change is linear. • For two sets of time periods, compute the percentage change from one time period to the next. If it is the same, the change is exponential.
Linear or exponential?Graphing method • Make an XY scatter diagram of the data. • If it appears to fall on a straight line, the function is linear. • If it has an accelerating curve upward or a decelerating curve downward it is exponential.
Linear or exponential?Graphing method Graphing method can be risky: Linear functions can closely approximate exponentially growing data over the short run.