Download
1 / 11
110 likes | 222 Vues
Evaluating modelled surface long wave downward radiation with Cabauw observations: The GABLS3 SCM case. Fred Bosveld (KNMI). Content: Motivation An improved formula for Long Wave Downward radiation High quality validation data Optimization of Improved formula Application in GABLS3 SCM

E N D
Evaluating modelled surface long wave downward radiation with Cabauw observations: The GABLS3 SCM case.Fred Bosveld (KNMI) • Content: • Motivation • An improved formula for Long Wave Downward radiation • High quality validation data • Optimization of Improved formula • Application in GABLS3 SCM • Conclusions EMS2013 09 - 13 Sep Reading UK
Motivation (1) • Emphasis on stable boundary layer and the transition periods • Intercomparison and evaluation of 19 Models • GABLS3 SCM case • 01-July-2006 • 24 hours • moderate geowind (7 m/s) EMS2013 09 - 13 Sep Reading UK
Motivation (2) • Long wave downward radiation • at the surface: • Models spread and underestimate • Models differ in: • - Thermodynamic profiles • - Profiles of GHG • - Radiation parameterization • How to evaluate? • - Get rid of the influence of Thermodynamic profiles! EMS2013 09 - 13 Sep Reading UK
Strategy • Start with Brunt (1932) L↓ as function of 2-m temperature (T2) and water vapour pressure (e2) • Half of L↓ at the surface originates from lowest 200 m (Ohmura, 2001) • Temperature gradient is important for L↓ (Dürr and Philipona, 2004) • Extend simple formula of Brunt (1932) with profile information • Optimize against high quality observations. EMS2013 09 - 13 Sep Reading UK
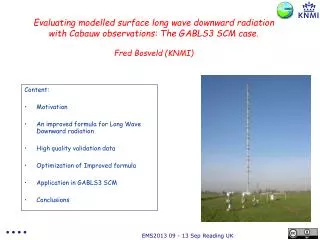
Observations from CESAR:Cabauw Experimental Site for Atmospheric Research • Observations of Cabauw (NL) (Boers et al., 2011) • Clear Sky detection very strict : • Nubiscope – low and middle clouds • Cloud radar – cirrus clouds • L↓ from Cabauw BSRN station: • Accuracy 2-3 W m-2 • 1 year of data (May 2008 – Apr 2009) EMS2013 09 - 13 Sep Reading UK
Results (Brunt, 1932) Optimized parameters a = 0.660± 0.002 b = 0.0419± 0.0007 Brunt deviates at day and night because upper air is warm at night and cool at day time EMS2013 09 - 13 Sep Reading UK
Results (Extensions of Brunt, 1932) • Separate Day and Night • Substitute part of surface radiation by radiation emitted at temperature of 200 m • Use e200 instead of e2 EMS2013 09 - 13 Sep Reading UK
Results (Optimizations) • 10 minute mean clear sky observations • N = 2450 all • N = 1480 night • N = 600 day • Add offset : improved but significant difference between night and day • Add T200 : Improved and much less difference between night and day • Change e2 -> e200: Improved further EMS2013 09 - 13 Sep Reading UK
Results (Improved and more general fit) Brunt deviates at day and night because upper air is warm at night and cool at day time Brunt Extended deviations almost gone because upper air temperature is taken into account EMS2013 09 - 13 Sep Reading UK
Coming back to GABLS3 SCM • 0400 UTC • ΔL↓= L↓ - L↓ref • Under estimation almost disappears after correcting for the effect of thermodynamic profiles on L↓. EMS2013 09 - 13 Sep Reading UK
Conclusions • An extension of the Brunt (1932) LWD formula is found: • More general in time than the original simple formula • Residuals in the fit approaches the high accuracy of the observation • The effect of e and T profile above 200 m is only statistically taken into account. • Thus the coefficients are most likely location dependent. • Application in GABLS3 SCM case: • LWD bias in most Models explained • Thermal coupling to the surface dominates T-profile. (Bosveld et al., 2013, BLM (In review)). • See Holtslag et al. (2013) (BAMS) for GABLS overview • See www.cesar-observatory.nl for information and data of CESAR T EMS2013 09 - 13 Sep Reading UK


![G3 - RADIO WAVE PROPAGATION [3 Exam Questions - 3 Groups]](https://cdn1.slideserve.com/3334254/g3-radio-wave-propagation-3-exam-questions-3-groups-dt.jpg)