Download
1 / 22
220 likes | 338 Vues
ICES/NAFO Decadal Symposium Santander, Spain 10-12 May, 2011. Changes in the NAO forcing in the North Atlantic during 2000-2009. K. Drinkwater, E. Colbourne, and H. Loeng. Outline. Introduction to North Atlantic Oscillation Temporal Variability in NAO Index Decadal

E N D
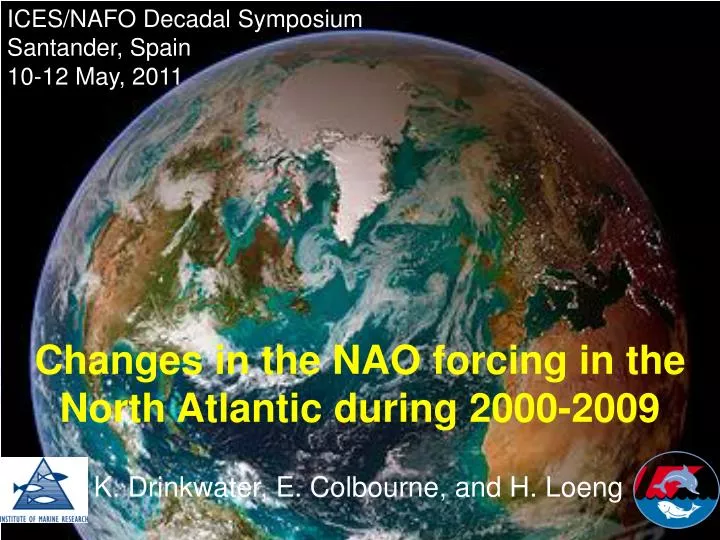
ICES/NAFO Decadal Symposium Santander, Spain 10-12 May, 2011 Changes in the NAO forcing in the North Atlantic during 2000-2009 K. Drinkwater, E. Colbourne, and H. Loeng
Outline • Introduction to North Atlantic Oscillation • Temporal Variability in NAO Index • Decadal • Spatial Variability in SSP patterns • EffectsonCompositeClimateIndex (SSTs, SSSs, SeaIce) • NW Atlantic-Norwegian/BarentsSea • Conclusions
Phases of the NAO • Positive Phase of NAO • deeper Low over Iceland, stronger High over the Azores • more northerly storm track • Colder, dryer in NW Atlantic • Warmer, wetter in Europe • Negative Phase of NAO • weaker Low over Iceland, weaker High over the Azores • weaker storms, move southerly • Warmer, wetter in NW Atlantic • Colder dryer in Europe
NAO linked to variability in SSTs, SSSs, subsurface SSTs, convection, strength of ocean currents, heat advection, etc. http://bit.ly/c5WPrR C.G. Fletcher
Hurrell NAO Index Winter (DJFM) NAO index using difference of normalized sea level pressure (SLP) between Lisbon, Portugal and Stykkisholmur/Reykjavik, Iceland since 1864. The SLP anomalies at each station were normalized by division of each seasonal mean pressure by the long-term mean (1864-1983) standard deviation. Hurrell website
NAO Time Series – DecadalVariability In 2000-2009 postive index but declined from high in 1990s, still 4th highest decade on record; within decade variance 4th lowest out of 14.
SeaLevelPressureAnomalies (Relative to 1968-1996) 2001 2002 2000 2003 2004
Sea Level Pressure Anomalies (Relative to 1968-1996) 2005 2006 2007 2008 2009
2000-09 Mean SLP and Anomalies Sea Level Pressure Sea Level Pressure Anomalies There were weak SLP anomalies with the largest variability in the NE Atlantic. Little difference in NW.
1950-59 1960-69 1970-79 1980-89 1990-99 2000-09
Positive SST anomalies throughout the North Atlantic. 2000-09 In contrast, earlier decades tend to show out of phase between NW and NE Atlantic. 1990-99
1950-59 1960-69 1980-89 1970-79
Normalized CLIMATE ANOMALIES Norway Labrador
Drinkwater et al., accepted • Composite Climate Indices based on 40 time series of meteorological, sea-ice and oceanographic conditions • Prior to late 1990s out-of-phase relationship, but since then they have been in phase. • Due to changes in atmospheric pressure patterns, weakening of NAO forcing
20-Year RunningMeanofCorrelationCoefficientsofCompositeClimateIndices for Labrador Sea and Norwegian/BarentsSeas Last Year of 20-yr time series Through 2000s negative correlation between 2 regions declining rapidly as both regions warming.
20-year RunningMeanofCorrelationCoefficientsofCompositeClimateIndiceswith NAO Last Year of 20-yr time series NAO shows significant weakening of correlation with Labrador region although strengthening in NE Atlantic.
Conclusions 1. NAO winter anomalies generally positive in 2000-2009, 4th highest decadal anomaly on record (14 decades) but relatively low within decade variability. 2. Mean of the decade shows most of the SLP action in the Northeast Atlantic. 3. Temperatures (salinities and ice) show similarity on both sides of the Atlantic, opposite to usual NAO response. 4. NAO index show weakening correlations with NW Atlantic climate index suggesting weakening of NAO forcing during 2000-2009.