OUR PLANET Unit 1-4a Understanding Populations
160 likes | 308 Vues
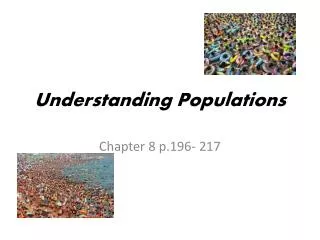
OUR PLANET Unit 1-4a Understanding Populations. For this unit only… Please use the abbreviation Pop. to represent Population. This will greatly reduce the time it takes to write population over & over again. How Do We Evaluate Populations?.

OUR PLANET Unit 1-4a Understanding Populations
E N D
Presentation Transcript
OUR PLANET Unit 1-4a Understanding Populations For this unit only… Please use the abbreviation Pop. to represent Population.This will greatly reduce thetime it takes to writepopulation over & over again.
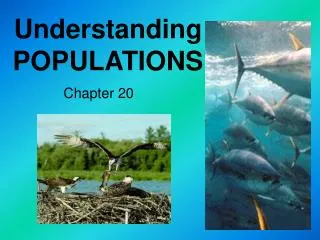
How Do We Evaluate Populations? Which data could be used to describe a puffin population? Three Population Characteristics include… Population Density – The numberof individuals in one area Dispersion – How individualsare distributed in an areaEven, Clumped, or RandomWhich are puffins? Growth Rate – Measureschanges in population size; Births – Deaths = Growth Rate How is a population affected by a negative growth rate?
Populations Can’t Grow Forever How quickly can a population of puffins grow? Reproductive Potential – The maximum number of offspring that a population can produce. A female elephant can theoreticallyproduce 20 million descendants inabout 1,000 years. Bacteria can produce 20 milliondescendants in a week. But a female puffin can only produce one egg per year. Which types of organisms have the greatest reproductive potential – herbivores or carnivores?
Populations Can’t Grow Forever How does the environment affect a population? Carrying Capacity – The maximum population that the environment can support for a long period of time What happens when thepopulation size exceedsthe carrying capacity? The carrying capacity is generally set by a…Limiting Factor – A resource needed by a population that limits its continual growth; Ex: Sunlight, food, water What are the limiting factors of a puffin population?
Larger or Smaller Populations? Two types of limiting factors that affect population size. Density Dependent – Deaths increase as a result of a larger population; Ex: limited resources & predation A crowded population willhave less resources to shareand attract more predators orDensity Independent –Deaths increase regardlessof population size;Ex: Natural disasters & Extreme weather
Let’s Review… What have you learned in this unit? 1. Explain what a negative growthrate would indicate. 2. Would a school of fish in theocean show even, clumped orrandom dispersion? 3. Does a person or a cat have agreater reproductive potential? 4. Describe what happens whena population exceeds its carryingcapacity. Why? 5. Is starvation density dependent?
OUR PLANET Unit 1-4b Human Populations
Human History Demography – The study of human populations The history of our human population was fairly stable until the 1800s when humans experienced… Exponential Growth –A growth rate thatcontinues to increaseeach year Demographerspredict a worldpopulation of 8 billionby the year 2025.
Forecasting Populations • Four factors affect population predictions… • Age Structure – The distribution of age in a population • Countries with high growth rates have more young people than old people…why? • Countries with slow • growth rates have even • distribution of ages • Which country has the highest growth rate? Lowest?
Forecasting Populations • 2. Survivorship – Percentageof a population that areexpected to survive to thenext age level • Type 1: Humans (offspring cared for immensely, long life span) • Type 2: Rodents (equal chance of death throughout lifespan) • Type 3:Sea Turtles (lots of offspring, most of which don’t survive) Which curve would humans in developed countries follow? What about developing countries?
Forecasting Populations 3. Fertility Rates – The number of babies born per 1,000 women. It’s an average. Most countrieshave a fertilityrate less than 3. Yet an averagewomen in Africamay have asmany as 6 kids. What would the fertility rate be if it was replacement level? 4. Migration – Immigration & emigration between countries Which has increased in developed countries, immigration or emigration rates?
The End Of Death? • Recently, life expectancies (the average age a person dies) has increased dramatically due to… • Medicine • More Food • Clean Water • Safe Waste Disposal • The average lifespanhas increased from40 years to over 80 years for many developed countries. • More successful births and less deaths = larger population
How Long Can This Continue? Do these graphs look similar? Where have we seen the graph on the right before? What is the carrying capacity for our human population?10 Billion people???
But Human Populations Are Different! Demographic Transition – A model that describes the four stages of human populations Stage 1 Population is low;Birth & death rates are high Stage 2 Because of education,Births stabilize and death ratesdecrease as the population grows Stage 3 Large population;Low birth and death rates Stage 4 Population begins to decrease
So Maybe There’s Hope If developed countries can spread education and wealth across the globe, there’s a chance we’ll be just fine
Let’s Review… What have you learned in this unit? 1. Besides people, what otherorganisms grow exponentially? 2. Describe the age structurefor the people living in your home. 3. List one factor that affectswomen’s fertility rates. 4. What factors have allowedour life expectancy to increase? 5. Because our population isstable, at which stage is the U.S.in demographic transition?