Development Strategy
Development Strategy. 2009. Pattern of Development. Data for International Comparisons. World Bank World Development Indicators


Development Strategy
E N D
Presentation Transcript
2009 Pattern of Development
Data for International Comparisons • World Bank World Development Indicators • Original developers of ICP working at University of Pennsylvania maintain historical dataset on expenditures called Penn World Tables (Penn World Tables) Much longer historical data and somewhat more detailed than WDI
Patterns of Economic Growth • Developed Economies experienced a golden age of per capita GDP growth during post-war period but have experienced slower growth since 1973 • Many developing economies also experienced fast growth during 1950-1973 but slowed markedly during 1973-1998. Some developed economies (India, Africa) have experienced a growth resurgence since then.
GDP per Capita vs. Productivity • Per Capita GDP can be broken down into two parts: GDP per Capita Productivity GDP per Engaged Person Employment Rate Engaged Person per Capita = X
GDP per Capita vs. Productivity • Per Capita GDP can be broken down into two parts: Productivity GDP per Hour Hour per Engaged Person Productivity GDP per Engaged Person = X
Labor Productivity Data • Key source for international comparisons in productivity is the Total Economy Database • Originally developed at University of Groningen Growth and Development Centre. Link Total Economy Database Link
Productivity Catch Up: EuropeSource: Groningen Growth & Development Center 2009 Intl$, GDP per Hour Worked (Y/L)
Productivity Catch Up: East AsiaSource: Groningen Growth & Development Center 2009 Intl$, GDP per Hour Worked (Y/L)
Productivity Catch Up?: Latin AmericaSource: Groningen Growth & Development Center 2009 Intl$, GDP per Hour Worked (Y/L)
Capital Accumulation • Capital Formation – Stock of equipment, machines, structures. • Incremental increase in capital is investment less some measure of depreciation
Capital Productivity • Capital Productivity: Capital investment is a central part of advancing productivity in developing economy but displays diminishing returns.
Measuring Capital ReturnsICOR Incremental Capital –Output Ratio: Ratio of constant dollar investment to increase in output • Measures number of dollar of investment needed to produce an extra dollar of output. LINK • ICOR is volatile, must take long run averages.
Total Factor Productivity • Weighted Average of Capital Productivity and Labor Productivity • Measures the total efficiency of the economy abstracting from the capital per worker. • Geometric Average:
Decomposing Growth • Growth in labor productivity is due to growth in TFP and Growth in the capital labor ratio.
Labor Quality Adjusted Purest measure of technical advance or efficiency gains
Tne Role of Government DevelOPMENT POLICY
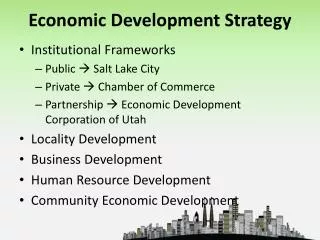
Structuralist Theory • Two kinds of economies • Developed • Underdeveloped • Key difference: Rich, developed economies dominated by industry; poor, underdeveloped dominant in agriculture and resources. • Development policy: shift countries from underdeveloped to developed.
Government Intervention • Capital is in short supply in developing economies so must be directed toward building of heavy industry. • Coordination failures – Set of infrastructure necessary to build the industrial economy has multiple inputs that must come on line at the same time. No need for a dam if there is no power network, no need for a power network if there are no factories, no need for factories if there is no power network. • Government can coordinate big push toward industrial development: Rosenstein-Rodan. • Example: India Link • Example: Brazil Link
Industrialization Structuralist Theory Predictions • Rosenstein-Rodan: Growth potential, combination of degree of investment and capacity to organize investment
Structuralist Theory and Trade • UNCTAD Economist Raul Prebisch developed the idea that prices of primary products would fall in value relative to manufactured goods. Link • International trade would always leave underdeveloped economies impoverished. • Use of tariffs and trade restrictions to develop domestic manufacturing sector. • Dependency Theory: International trade enforces a system of power that relegates developing countries to producing raw material and cheap labor. Lesson: self-reliance.
Criticisms • High cost of imports and import substitutes reduces economic efficiency making people poorer. • Developing economies operate on too small of a scale to be efficient in capital heavy goods. • Created monopolies protected from competition • Source of corruption Link - Krueger.
Washington Consensus • Fiscal Discipline.- Balanced Budget. • Reordering Public Expenditure Priorities. Eliminate biased subsidies, increase health, education and infrastructure. • Tax Reform. Broad tax base with moderate marginal tax rates. • Liberalizing Interest Rates • Competitive Exchange Rate http://www.iie.com/publications/papers/williamson0904-2.pdf
Identified as a consensus for development by policymakers in Washington (World Bank, IMF) and particularly Latin America. • Trade Liberalization • Liberalization of Inward Foreign Direct Investment. • Privatization. • Deregulation. specifically on easing barriers to entry and exit. • Property Rights
Neo-classical ViewPhysical & Human Capital Deepening • High investment rates beginning in 1970’s • Rapid growth in education rates. • Macroeconomic Stability: Low inflation, small budget deficits • Market Orientation: South Korea vs. North Korea
Revisionist View • East Asia not exemplar of Washington Consensus • Government heavily involved in the economy • Developmental State – Chalmers Johnson • Ideological devotion to development • Independent bureaucracy embedded within the economy playing a leading role. • Developing industries protected from international competition • Friedrich List’s American system
World Bank View • High levels of investment supported by high level of savings • Government institutions: Savings banks and mandatory provident funds developed to overcome market failures • Expansion in Education Broad based rather than concentrated in elite
Government Intervention • “Market friendly” – Macroeconomic stability and strong property rights encourage private investment but,… • Strong Bureaucratic State to Promote Growth Key Interventions • Financial repression to promote corporate investment • Allocation of Resources (Credit & Foreign Exchange) to Export Industries
Market Failure: Externalities • Some economic activities creates negative spillovers: Pollution, Crime • Private benefits but public costs. • Some economic activities create positive spillovers: knowledge. Developing new knowledge may create public benefits that will accrue to people who do not pay for the costs
Pillars of East Asian Growth MiracleWorld Bank Chief Economist View • Gov’t intervention in East Asia overcomes market failures • Underdeveloped financial markets – gov’t intervention fills • Gov’t intervention supports knowledge producing activities. • Technical education and research • Deliberative councils, research consortia • FDI • Export industries
Foreign Direct Investment Two key elements need to be emphasized in the definition of FDI: • long-term nature or of “lasting interest.” • the investor has a “significant degree of influence” on the management of the enterprise. For operational purposes, 10 per cent of the voting shares or voting power is the level of ownership necessary for a direct investment interest to exist (IMF, 1993, paragraph 362; OECD, 2008, paragraph 117) UNCTAD Training Manual on Statistics for FDI and the Operations of TNCs Volume I FDI Flows and Stocks LINK
Pro’s and Cons of FDI Pro: • Increased domestic capital formation. • FDI brings superior technology • Increases domestic competition • Gives access to export markets. • FDI more stable than loans or capital flows. • Con: • Multinationals may interfere with local political economy. • Foreign nationals fill top jobs. Link #1 Link #2