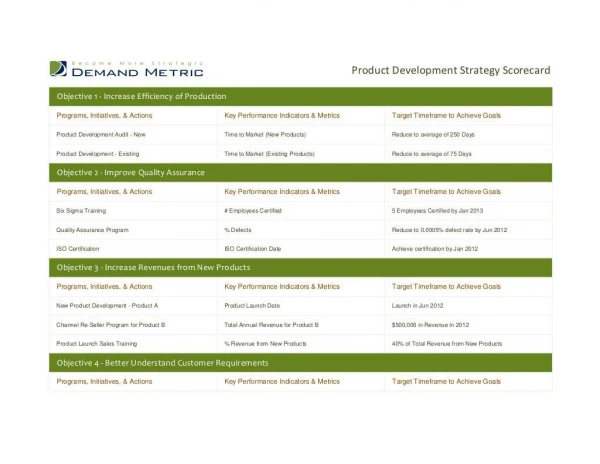
PRODUCT DEVELOPMENT STRATEGY
Explore why developing new products is crucial, from changes in consumer lifestyles to technological advancements and market demands. Learn about examples and stages of product development process from concept generation to product testing.

PRODUCT DEVELOPMENT STRATEGY
E N D
Presentation Transcript
Why develop new products? • Changes in consumers’ lifestyles such as healthy eating ranges, ethnic foods, children’s products, snacking. • Technological developments in food production. • Changes in type of retail food outlets. • The changing buying power of the consumer.
Can you think of examples where a product has been developed to fit different market requirements?
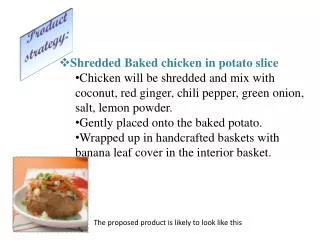
Sachets useful for measuring correct amount of liquid , then convenient pots, ready to add liquid, stir and eat.
Now we have the bar, ready to eat on the move as well as a variety of flavours available in the range • Range of flavours also available • Golden syrup
Consider taking a page for each stage and make a mind map of all the relevant information about that part of the process.Start by adding the info you already know from Nat 5 – then you can add in the extra detail needed for Higher.
STEP 1- CONCEPT GENERATION The thinking stage – new ideas or a gap in the market
Development of ideas from market analysis, perhaps even trialling ofpopular existing products, looking at, for example, why a certainflavour is popular, looking for something similar yet new anddifferent.
Manufacturers do not want to replicate existing products in the market.
Developers will consider cost, portion size, methods of reheating and cooking, flavour, texture and appearance.
Impact on the food development process • Without this stage the development strategy cannot go forward • It will ensure the product is new, different to what is already on the market and appeal to consumers as they have carried out research to find out what the trends and consumers are looking for in a new product
STEP 2 CONCEPT SCREENING Consider all ideas, keep some and discard others. The best ideas will be taken forward.
Allows the manufacturer to develop a specification against which todevelop ideas.
Impact on the product development process • Allow product ideas to be generated so that a prototype can be developed for the new product
STEP 3 – PROTOTYPE PRODUCTION • A prototype is an example or specimen of what the product will be like. • The prototype is developed and measured against the specification.
Impact on the product development process • The prototype is tested for appeal and may be further modified or rejected so that it appeals/ looks attractive to the consumer helping to increase sales
STEP 4: PRODUCT TESTING This is an important stage as it allows the products to be tested on consumers, so opinion can be obtained
Always check that everyone is able to taste the product →Some people may have allergies or special dietary needs, e.g.diabetics or vegetarians, that mayprevent them from tasting
Always practise good hygiene when tasting. Everyone uses clean spoonsand separate dishes → This prevents infection being spread from person to person
Do not allow people who are unwell (colds, upset stomachs) to taste → They could spread their infection or their illness couldalter the true flavour of the foodfor them
Serve all food samples in the same way (same size portions, similar plates,same temperature)→ This ensures the food is fairlycompared
Label the foods with random letters or numbers → So people cannot identify thesamples
Only allow tasters to test up to six samples at a time → The taste buds will become less effective after more than this
Have water available to sip between tastings, or a dry biscuit → This will help clear the palate and make tastings more effective on a number of samples
Complete the tasting charts after each person tastes the food → If this is not done, the taster may forget his/her opinion.
Use separate booths for each taster → To ensure no influence from other tasters
Ranking test Please taste the samples and rank them in the order you like best. 1 = the one you like best, 5 = the one you like least
Rating test In this test, foods may be given a score of 1 to 5 1. Dislike a lot 2. Dislike a little 3. Neither like nor dislike 4. Like a little 5. Like a lot Samplers complete a chart similar to the one below and circle the number that describes the product
like a lot neither like nor dislike dislike Tick the box/ rating that matches your response
Discrimination Tests can be used to: – evaluate the difference between similar products – evaluate specific attributes, e.g. smoothness – gauge consumer response to new products – check that a food product meets its original specification .
Paired comparison test Tasters are asked to compare two samples for a specific characteristic, e.g. flavour or seasoning of the dish, e.g.
Duo–trio test Out of three samples, tasters are told which is the control and are then asked which of the other two samples differs from the control
Triangle test Tasters are presented with three samples, two of which are the same, and are asked to identify the odd one out
The diagram shown is called a star diagram because it is drawn in the shape of a star. Each line of the star is marked on a scale of 1 to 5 (where 1 is the least and 5 is the most), and Each line is labelled with a descriptor – a word which describes the food product.
saltiness Star diagram for tomato sauce flavour acidity sweetness Red colour Tomatoey-ness thickness smoothness
These results show that this tomato sauce has a good colour, flavour, thickness and average sweetness. It is not very acidic.
Manufacturers use this method to compare their own products with one which is popular with consumers, in order to see where they need to improve their own product
Impact on the product development process • Allows the range of possible solutions to be further refined – the most suitable and popular product will be kept and further refined or eliminated as a result of consumer opinions.
FIRST PRODUCTION RUN • The process allows for the actual item to be made in bulk for the first time and its suitability assessed