1 / 0

New Product Planning, Strategy, and Development Contents

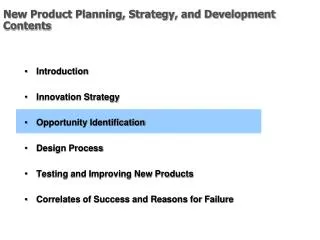
New Product Planning, Strategy, and Development Contents. Introduction Innovation Strategy Opportunity Identification Design Process Testing and Improving New Products Correlates of Success and Reasons for Failure. Steps in Opportunity Identification.

skyler
Télécharger la présentation

New Product Planning, Strategy, and Development Contents

An Image/Link below is provided (as is) to download presentation Download Policy: Content on the Website is provided to you AS IS for your information and personal use and may not be sold / licensed / shared on other websites without getting consent from its author. Content is provided to you AS IS for your information and personal use only. Download presentation by click this link. While downloading, if for some reason you are not able to download a presentation, the publisher may have deleted the file from their server. During download, if you can't get a presentation, the file might be deleted by the publisher.

E N D

Presentation Transcript


  1. New Product Planning, Strategy, and DevelopmentContents Introduction Innovation Strategy Opportunity Identification Design Process Testing and Improving New Products Correlates of Success and Reasons for Failure
  2. Steps in Opportunity Identification Chapter 4: Market Definition and Entry Strategy Step 1: Identification of markets that offer the best opportunities for the organization Step 2: Detailed definition of these markets by determining the boundaries of each market and the relationship between the market and the product line Step 3: Selection of markets for new products and product line expansion, with the best prospects and organizational match Chapter 5: Idea Generation Step 4: Generation of product ideas to tap the potential of selected markets Step 5: Refinement and screening of these ideas
  3. Opportunity Identification Chapter 4: Market Definition and Entry Strategy (Part 1) Step 1: Identification of markets that offer the best opportunities for the organization Step 2: Detailed definition of these markets by determining the boundaries of each market and the relationship between the market and the product line Step 3: Selection of markets for new products and product line expansion, with the best prospects and organizational match Chapter 4: Market Definition and Entry Strategy (Part 2) Focus on the Bass Model
  4. Step 1: Identification of markets :Desirable Characteristics of Markets-The Seven Criteria We shall examine each of the seven criteria in detail
  5. Growth Potential Market Potential is measured by: Size of the market in dollar sales Growth rate of the market Size is important, but growth potential is more important since a growing market is also where prices and margins are generally higher and therefore more desirable To fully understand the growth potential of a market we need to be able to estimate the size and the growth rate
  6. Growth Potential: The Bass Model The rate at which a product diffuses into a market is a measure of its growth potential A market for a product may be thought of as consisting of two groups of adopters Innovators Imitators The rate of innovation diffusion will be governed by the relative size of these two groups and their respective propensity to innovate or imitate The Bass Model uses the sales data from the first few years of a product category launch to create the estimated pattern of sales for the product category during its entire lifecycle
  7. Actual versus Fitted Data using the Bass Model Actual and Fitted Adoption of VCR's 1980-1989 12000 10000 8000 Actual Adoption 6000 Fitted Adoption 4000 Adoption in Thousands 2000 0 80 81 82 83 84 85 86 87 88 89 Year
  8. Actual versus Fitted Data using the Bass Model Note how similar the shapes of the actual and fitted adoption curves are to the familiar shape of the product life cycle (PLC) The adoption curves exhibit all the stages of the PLC Introduction Growth Maturity Decline Thus the Bass Model possesses sufficient descriptive accuracy and is also consistent with the theoretical concept of PLC With limited data and by making realistic assumptions, the Bass Model can be used by product managers to arrive at not only the market potential for a product but also the estimated pattern of sales for each year in the product’s life cycle We will explore the Bass Model in greater detail in Part 2 of this chapter
  9. Early Entry Significant rewards accrue to successful pioneering brands Early –entry advantage can be sustained Pioneers on average have a dominant 40 % of market Early entry advantage occurs due to best initial position entry barriers
  10. Economies of Scale/Experience Curve Experience curve indicates that for many manufacturing industries, the unit cost of producing and distributing a product declines at a constant rate for each doubling of the cumulative sales by the firm If the experience curve exists, high market share in a large market is a good way to move to lower unit costs Large share in a market gives control over strategy in the market
  11. Competitive Attractiveness Watch out for hostile competitive environment US auto industry was vulnerable to higher quality and fuel efficient cars produced in Japan and Europe (1980s) Jergens was vulnerable to Vaseline Intensive Care lotion Google wiped out many search engines through a combination of superior product and marketing strategy If entry is likely to precipitate a price war and strong retaliatory actions from existing players, the market is less attractive
  12. Investment Investment Higher the investment required by a market, the less attractive it is Besides direct financial requirements, an organization must consider scarce resources like managerial talent, capital equipment, laboratory resources, etc
  13. Reward If ROI is high, large investments are justified If ROI is low, even low investments are not justified Decision will depend on whether the organization has excellent financial resources or good channels of distribution, advantageous location or not
  14. Risk Markets characterized by uncertainty are less attractive If demand is unknown or subject to rapid and large fluctuations, the risk of product failure is high Uncertainty can also be evident in supply of key raw materials and their prices
  15. Opportunity Identification Technique-Market Profile Analysis 1. Enumerate and weigh the market-selection criteria for your organization. You may select from among the seven criteria presented earlier 2. Rate each market on each chosen criterion 3. Calculate the overall weighted sum of the rating for each market 4. Examine the summary ratings to identify the market with the best overall appeal
  16. Opportunity Identification Technique-Market Profile Analysis (contd.) The market with the highest ratings would reflect the best opportunity for continued investigation Markets with very low ratings are eliminated The final choice is based on managerial judgment, aided by careful interpretation of the ratings
  17. Step 2a: Detailed Definition of the Market: Definition by Segmentation Market Segmentation is the identification of a group of relatively similar consumers who have needs or responses that are different from other consumers A product intended for the total market may have only marginal success if the market consists of several segments very distinct from one another
  18. Market Definition- Criteria for Segmentation Demographics families with young children are interested in safer cars younger people like sweeter taste SIC code to decide on size and allocation of sales and account teams to organizations
  19. Market Definition- Criteria for Segmentation Attitudes Computer haters, functional adopters and computer literates react differently to product/market stimuli
  20. Market Definition- Criteria for Segmentation (contd.) Preference for product benefit Superior washing effectiveness versus environmentally safe detergents Large economy pack versus small easy to carry and store packs Price Sensitivity Premium customers Midrange customers Bargain customers
  21. Market Definition- Criteria for Segmentation (contd.) Decision Rules Customers are grouped based on similarities and differences in decision making processes e.g. centralized purchases versus regional office purchases Usage behavior Heavy users may need special service With products that have several possible uses, segmentation as a function of use is appropriate e.g. computers for home users versus computers for educational institutes
  22. Market Definition- Criteria for Segmentation (contd.) Product Form Liquid detergent versus detergent cakes Canned versus fresh vegetables Competitive Products Defined as the product that a consumer switches to if the preferred product is unavailable Shaving foam and shaving gel therefore may not be competitive products after all
  23. Methods for Market Segmentation Cluster Analysis Based on the principle that consumers within a cluster are similar and consumers in one cluster are dissimilar from consumers in the other clusters Product substitution methods Degree of substitution in use Observe sequence of issues considered and decisions made by consumers when substituting Observe or measure Product Switching in a panel of consumers
  24. Methods for Market Segmentation (contd.) Product Consideration sets Design and promote the product so that it follows a particular branch in the hierarchy of categorization by consumers ( e.g. country of origin, luxury, power, price, psychological image, etc.)
  25. Step 2b: Determining the relationship between the market and the product Roger’s Five Factors: Diffusion of innovation as a function of product differences
  26. Innovation Diffusion –Roger’s Five Factors Why do some products diffuse rapidly, while others diffuse slowly, or not at all? Relative advantage The degree to which a product is better than the product it replaces Compatibility The degree to which a product is consistent with existing values and experiences Complexity The degree to which a product is difficult to understand and use Trialability The degree to which a product may be experimented with on a limited basis Observability The degree to which product usage and impact are visible to others These five factors together are known to explain 49% to 87% of the variance in the rate of diffusion
  27. Important A product needs to be perceived as new by the given set of people (a mature product in one market may be perceived as new by another market)
  28. Relative Advantage Relative Advantage: The degree to which a product is better than the product it replaces or the idea it supersedes Perceived economic benefits Reduced costs (decrease in time, effort, or dollars) (Store brands) Increased or new benefits (greater productivity, greater efficacy or greater reach) (Google) Subjective benefits Social status, prestige (Related WSJ Article: One Thing is Clear)
  29. Relative Advantage Relative advantage as perceived by the potential adopter is what really matters Relative advantage is a necessary , but not sufficient, product based driver of innovation diffusion
  30. Compatibility Compatibility: The degree to which a product is consistent with existing values and experiences of the potential adopter Compatibility with values and beliefs Fine wine bottles will be sealed with cork stoppers Compatibility with previously adopted ideas Concentrated liquid laundry detergent requires lower dosage Avoid compatibility with failed ideas Clear Coke Avoid compatibility with successful ideas when both firms and consumers want to be on the cutting edge Zune, Music
  31. Compatibility Generally, as the compatibility of an innovation with existing concepts, habits, and experiences increases, the rate of product adoption also increases
  32. Complexity Complexity: The degree to which a product is difficult to understand and use Complex: PC, VCR, TiVO Simple: Google
  33. Complexity As the perceived complexity of an innovation increases, the rate of adoption decreases
  34. Trialability Trialability: The degree to which a Product may be experimented with on a Limited basis Test drive a car Free limited period trial (Bose) In store demo (HDTVs in Circuit City)
  35. Trialability As the trialability of a product increases, the rate of product adoption also increases
  36. Observability Observability: The degree to which product usage and impact are visible to others Second car Satellite TV Turbo-tax Hummer SUVs
  37. Observability The more visible or observable the usage and outcome of an innovation, the greater the rate of product adoption
  38. Importance of Roger’s Five Factors Understanding and managing these five factors is important to: Predict the rate of product diffusion Develop products that are more likely to be adopted Tailor marketing efforts to leverage positive factors and overcome negative factors
  39. Using the Five Factors to Understand the Adoption of the Telephone in the early 1900s Relative advantage Need to reach out and touch someone- In 1900, the relative advantage is not obvious Not enough people own a telephone Compatibility A voice coming out of a metal box was unsettling or even frightening for many in the late 1800s Complexity It was strikingly complex to understand (can it transmit diseases, can I get electrocuted, does it speak my language?) Trialabilty Initially the telephone was limited to the very wealthy and to high-end business Observability Wiring
  40. It has taken more than a century of diffusion to get here….. Thus, the Roger’s Five Factors provide us some guidelines to answer the question: Why do some products diffuse rapidly, while others diffuse slowly, or not at all?
  41. Diffusion of Innovation: A summary of the different approaches available Rogers and Moore (People Differences) The Bass Model (People Differences) Roger’s Five Factors (Product Differences)
  42. Rogers and Moore Categorization of Adopters (People Differences) Adapted from Everett Rogers, Diffusion of Innovation Innovators Early adopters Early majority Late majority Laggards
  43. Innovators and Imitators-The Bass Model (People Differences) Only two groups Innovators Imitators Rate of innovation diffusion will be governed by the relative size of these two groups and their respective propensity to innovate or imitate
  44. Innovation Diffusion –Roger’s Five Factors(Product Differences) Rate of diffusion depends on: Relative advantage The degree to which a product is better than the product it replaces Compatibility The degree to which a product is consistent with existing values and experiences Complexity The degree to which a product is difficult to understand and use Trialability The degree to which a product may be experimented with on a limited basis Observability The degree to which product usage and impact are visible to others
  45. Summary Product based (Roger’s Five Factors) versus people based (Rogers and Moore Categorization and The Bass Model) approaches to diffusion are alternative but complementary methods for defining markets
  46. Step 3: Selection of markets for new products and product line expansion, with the best prospects and organizational match: Product Portfolio Considerations Array all products in the portfolio on a grid of market attractiveness and competitive advantage before allocating resources to new product * - Existing market-maintain position Ø- Existing market-expand industry or move to more attractive segment @- Existing market- build competitive advantage X - Existing market- exit, divest Δ - Priority new markets to enter δ - New markets- low priority - Direction to move portfolio Market attractiveness Competitive advantage Related WSJ Article: General Mills Tries to Persuade Americans to Cook Chinese
More Related