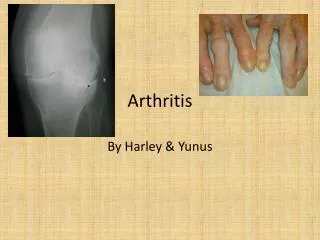
Arthritis Imaging Project
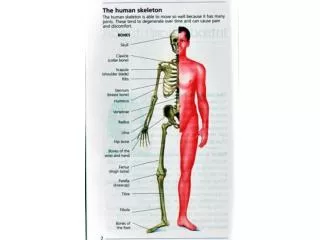
This project employs Micro-CT imaging to quantitatively evaluate the effects of arthritis in mice. By analyzing excised paw samples from naïve, mild, and severe arthritis models, the study aims to measure key parameters such as Joint Cortical Bone Volume (JCBV), Cortical Bone Density (CBD), and Periosteal New Bone Volume (PNBV). Utilizing advanced imaging techniques and parameters, including a cone beam x-ray source and high-resolution rendering, we establish significant variations in bone density and volume across different arthritis severities, aiding in further understanding this disease.

Arthritis Imaging Project
E N D
Presentation Transcript
Project Goals Quantified evaluation of arthritis in mice using Micro-CT imaging of excised naïve, mild and severe paw samples to identify: • Joint Cortical Bone Volume (JCBV) • Cortical Bone Density (CBD) • Periosteal New Bone Volume (PNBV)
Micro-CT Imaging ParametersGM-I X-O™ MicroCT • Cone beam x-ray source • X-ray source voltage = 75 keV • 50 µm pixel pitch with 3x magnification • 17 µm reconstructed voxel size • 1024 projections • 500 msec integration time • 390 µA total current • 0.15 Gy radiation dose • 8 minute acquisiton
GM-I Study • Images • 3D Surface Rendering of Cortical Bone Naïve Severe
GM-I Study • Images • Segmentation of MTP Joints 1 mm above and 2 mm below the joint
GM-I Study • Images • Cross-Sections of Segmented Cortical Bone (A) and Periosteal New Bone (B) A Threshold: Cortical 2200 / New Bone 1500 B
GM-I Study Results • Cortical Bone Density • Naïve 2622.67 • Mild 2727.67 • Severe 2659.981
GM-I Study Results • Joint Cortical Bone Volume • Naïve • 0.36 mm3 (2nd) • 0.36 mm3 (3rd) • 0.36 mm3 (4th) S.D. = 0 • Mild • 0.48 mm3 (2nd) • 0.48 mm3 (3rd) • 0.50 mm3 (4th) S.D. = .0115 • Severe • 0.26 mm3 (2nd) • 0.22 mm3 (3rd) • 0.19 mm3 (4th) S.D. = .035
GM-I Study Results • Periosteal New Bone Volume • Naïve • 7.35 mm3 (48%) • 15.30 mm3 (Total bone volume) • Mild • 7.12 mm3 (43%) • 16.26 mm3 (Total bone volume) • Severe • 7.67 mm3 (59%) • 12.9 mm3 (Total bone volume)
GM-I Study Bone volumes and density were calculated using built-in software for quantification analysis