Download

1 / 88
890 likes | 1.25k Vues
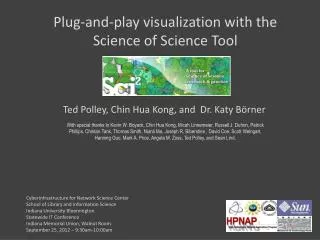
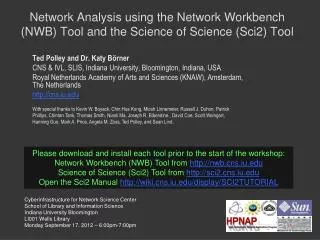
“Sci2 Tool: A Tool for Science of Science Research and Practice" Tutorial Dr . Katy Börner CNS & IVL, SLIS, Indiana University, Bloomington, Indiana, USA Royal Netherlands Academy of Arts and Sciences (KNAW), Amsterdam, The Netherlands http ://cns.iu.edu

E N D
“Sci2 Tool: A Tool for Science of Science Research and Practice" Tutorial Dr. Katy Börner CNS & IVL, SLIS, Indiana University, Bloomington, Indiana, USA Royal Netherlands Academy of Arts and Sciences (KNAW), Amsterdam, The Netherlands http://cns.iu.edu With special thanks to Kevin W. Boyack, Chin Hua Kong, Micah Linnemeier, Russell J. Duhon, Patrick Phillips, Chintan Tank, Thomas Smith, NianliMa, Joseph R. Biberstine , David Coe, Scott Weingart, HanningGuo, Mark A. Price, Angela M. Zoss, Ted Polley, and Sean Lind. Please - download the Sci2 Tool from http://sci2.cns.iu.edu and - complete the Pre-Tutorial Questionnaire Portfolio Analysis Symposium NIH Natcher Auditorium, Bethesda, MD Tuesday July 24, 2012 • 2-3:30pm
Software, Datasets, Plugins, and Documentationalso distributed on Memory Stick and DVD • These slides • http://ivl.slis.indiana.edu/km/pres/2012-borner-sci2tutorial-nih.pdf • Sci2 Tool Manual v0.5.1 Alpha, updated to match v1.0 Alpha tool release http://sci2.wiki.cns.iu.edu • Sci2 Tool v1.0 Alpha (June 13, 2012) • http://sci2.cns.iu.edu • Additional Datasets http://sci2.wiki.cns.iu.edu/2.5+Sample+Datasets • Additional Plugins http://sci2.wiki.cns.iu.edu/3.2+Additional+Plugins Or copy them from the DVD or memory stick. Postscript Viewer: Please try opening ‘chessboard.ps.’ You should see 2
2p Welcome and Overview of Tutorial and Attendees 2:15p Sci2 Tool Hands-on Download and run the Sci2 Tool Temporal Analysis: Horizontal line graph of NSF projects Geospatial Analysis: US and world maps Geospatial Analysis: Geomap with network overlays Topical Analysis: Visualize research profiles Network Analysis: Co-occurrence networks and bimodal networks Network Analysis: Evolving collaboration networks 3:15p Outlook and Q&A 3:30p Adjourn Tutorial Overview 3
2p Welcome and Overview of Tutorial and Attendees 2:15p Sci2 Tool Hands-on Download and run the Sci2 Tool Temporal Analysis: Horizontal line graph of NSF projects Geospatial Analysis: US and world maps Geospatial Analysis: Geomap with network overlays Topical Analysis: Visualize research profiles Network Analysis: Co-occurrence networks and bimodal networks Network Analysis: Evolving collaboration networks 3:15p Outlook and Q&A 3:30p Adjourn Tutorial Overview 4
Using the Sci2 Tool to Visualize Tutorial Registrants Use ‘File > Read’ to load cleaned Sci2TutorialRegistrants.csvwith 41 records Run ‘Data Preparation > Extract Bipartite Network’ With parameter values: Visualize resulting ‘Bipartite network from Affiliation to Background’ using ‘Visualization > Network > GUESS’ and ‘Layout > GEM’, ‘Layout > Bin Pack’
Sci2 Tool – Visualize Tutorial Attendees:Bi-partite Organization-Title Network Organization Title
Sci2 Tool – Visualize Tutorial Attendees:Bi-partite Organization-Title Network Organization Title
2p Welcome and Overview of Tutorial and Attendees 2:15p Sci2 Tool Hands-on Download and run the Sci2 Tool Temporal Analysis: Horizontal line graph of NSF projects Geospatial Analysis: US and world maps Geospatial Analysis: Geomap with network overlays Topical Analysis: Visualize research profiles Network Analysis: Co-occurrence networks and bimodal networks Network Analysis: Evolving collaboration networks 3:15p Outlook and Q&A 3:30p Adjourn Tutorial Overview 8
Science of Science (Sci2) Toolhttp://sci2.cns.iu.edu • Explicitly designed for SoS research and practice, well documented, easy to use. • Empowers many to run common studies while making it easy for exports to perform novel research. • Advanced algorithms, effective visualizations, and many (standard) workflows. • Supports micro-level documentation and replication of studies. • Is open source—anybody can review and extend the code, or use it for commercial purposes. 9
Sci2 Tool v0.5.2 Alpha (Dec 19, 2011) • New Features • Support new Web of Science format from ISI • Support network overlay for geographical map • Support Prefuse's visualizations on Macs OS • Improvements • Improve memory usage and processing time of Extract top N nodes and Extract top N Edges algorithms • Unify merging algorithms used by database • Bug fixes • Fix legend boundary issue in geographical map • Fix typo error on the output data label • Fix slice by year algorithm 10
Sci2 Tool v1.0 Alpha (June 13, 2012) • Major Release • featuring a Web services compatible CIShellv2.0 (http://cishell.org) • New Features • Google Scholar citation reader • New visualizations such as • geospatial maps • science maps • bi-modal network layout • R statistical tool bridging • Gephivisualization tool bridging • Comprehensive online documentation • Release Note Details • http://wiki.cns.iu.edu/display/SCI2TUTORIAL/4.4+Sci2+Release+Notes+v1.0+alpha 11
Needs-Driven Workflow Design using a modular data acquisition/analysis/ modeling/ visualization pipeline as well as modular visualization layers. Börner, Katy (2010) Atlas of Science. MIT Press. 13
Sci2 Tool – Supported Data Formats Input: Network Formats • GraphML(*.xml or *.graphml) • XGMML (*.xml) • Pajek .NET (*.net) • NWB (*.nwb) Scientometric Formats • ISI (*.isi) • Bibtex (*.bib) • Endnote Export Format (*.enw) • Scopus csv (*.scopus) • NSF csv (*.nsf) Other Formats • PajekMatrix (*.mat) • TreeML (*.xml) • Edgelist (*.edge) • CSV (*.csv) Formats are documented at http://sci2.wiki.cns.iu.edu/display/SCI2TUTORIAL/2.3+Data+Formats. Output: Network File Formats • GraphML (*.xml or *.graphml) • Pajek .MAT (*.mat) • Pajek .NET (*.net) • NWB (*.nwb) • XGMML (*.xml) • CSV (*.csv) Image Formats • JPEG (*.jpg) • PDF (*.pdf) • PostScript (*.ps) 14
Sci2 Tool – Supported Tools GUESS exploratory data analysis and visualization tool for graphs and networks. https://nwb.slis.indiana.edu/community/?n=VisualizeData.GUESS. Gnuplot portable command-line driven interactive data and function plotting utility http://www.gnuplot.info/. 15
Sci2 Tool – Supported Tools Adding more layout algorithms and network visualization interactivity via Cytoscape http://www.cytoscape.org. Simply add org.textrend.visualization.cytoscape_0.0.3.jar into your /plugin directory. Restart Sci2 Tool Cytoscape now shows in the Visualization Menu Select a network in Data Manager, run Cytoscape and the tool will start with this network loaded. 16
Sci2 Tool – Bridged Tools R statistical tool bridging Gephivisualization tool bridging 17
Sci2 Tool: Download, Install, and Run Sci2 Tool v1.0 Alpha (June 13, 2012) Can be freely downloaded for all major operating systems from http://sci2.cns.iu.edu Select your operating system from the pull down menu and download. Unpack into a /sci2 directory. Run /sci2/sci2.exe Sci2 Manual is at http://sci2.wiki.cns.iu.edu Cite as Sci2 Team. (2009). Science of Science (Sci2) Tool. Indiana University and SciTech Strategies, http://sci2.cns.iu.edu .
Sci2 Tool: Download, Install, and Run Sci2 Tool v1.0 Alpha (June 13, 2012) Sci2 Tool runs on Windows, Mac, and Linux. Unzip. Run /sci2/sci2.exe
Sci2 Tool Interface ComponentsSee also http://sci2.wiki.cns.iu.edu/2.2+User+Interface Use Menu to read data, run algorithms. Console to see work log, references to seminal works. Data Manager to select, view, save loaded, simulated, or derived datasets. Scheduler to see status of algorithm execution. All workflows are recorded into a log file (see /sci2/logs/…), and soon can be re-run for easy replication. If errors occur, they are saved in a error log to ease bug reporting. All algorithms are documented online; workflows are given in tutorials, see Sci2 Manual at http://sci2.wiki.cns.iu.edu
2p Welcome and Overview of Tutorial and Attendees 2:15p Sci2 Tool Hands-on Download and run the Sci2 Tool Temporal Analysis: Horizontal line graph of NSF projects Geospatial Analysis: US and world maps Geospatial Analysis: Geomap with network overlays Topical Analysis: Visualize research profiles Network Analysis: Co-occurrence networks and bimodal networks Network Analysis: Evolving collaboration networks 3:15p Outlook and Q&A 3:30p Adjourn Tutorial Overview 21
Horizontal line graph of NSF projects See 5.2.1 Funding Profiles of Three Universities (NSF Data) Download NSF data Visualize as Horizontal Line Graph Area size equals numerical value, e.g., award amount. Text Start date End date 22
Horizontal line graph of NSF projects NSF Awards Search via http://www.nsf.gov/awardsearch Save in CSV format as *institution*.nsf 23
Temporal bar graph of NSF projects Download and load a dataset of your choice or load one of the sample data files, e.g., ‘sampledata/scientometrics/nsf/Indiana.nsf.’ Run ‘Visualization > Temporal > Temporal Bar Graph’using parameters: Save ‘visualized with Horizontal Line Graph’ as ps or eps file. Convert into pdf and view. Zoom to see details in visualizations of large datasets, e.g., all NSF awards ever made. 24
SciSIP Funding for Sci2 Tool TLS: Towards a Macroscope for Science Policy Decision Making
Seven grants by the “Indiana University of Pennsylvania Research Institute” should be excluded. Rerun analysis.
Date of Data Download Area size equals numerical value, e.g., award amount. Text, e.g., title Start date End date TLS: Towards a Macroscope for Science Policy Decision Making
Temporal bar graph of NSF projects Area size equals numerical value, e.g., award amount. Text, e.g., title Start date End date More NSF data workflows can be found in wiki tutorial: 5.1.3 Funding Profiles of Three Researchers at Indiana University (NSF Data) 5.2.1 Funding Profiles of Three Universities (NSF Data) 5.2.3 Biomedical Funding Profile of NSF (NSF Data) 29
2p Welcome and Overview of Tutorial and Attendees 2:15p Sci2 Tool Hands-on Download and run the Sci2 Tool Temporal Analysis: Horizontal line graph of NSF projects Geospatial Analysis: US and world maps Geospatial Analysis: Geomap with network overlays Topical Analysis: Visualize research profiles Network Analysis: Co-occurrence networks and bimodal networks Network Analysis: Evolving collaboration networks 3:15p Outlook and Q&A 3:30p Adjourn Tutorial Overview 30
Geocoding and Geospatial Mapshttp://wiki.cns.iu.edu/display/CISHELL/Yahoo+Geocoder Region names + numeric data (Choropleth Map) Geocoordinates + numeric data (Proportional Symbol Map) 31
Load File with Address and Times Cited Fields Run ‘File > Load…’ and select the sample data table ‘sampledata/geo/usptoInfluenza.csv’ Create a map of influenza patents held by different countries. 32
Yahoo Geocoder http://wiki.cns.iu.edu/display/CISHELL/Yahoo+Geocoder 33
Using Yahoo! Geocoder Run ‘Analysis > Geospatial > Yahoo Geocoder’ You can leave Application ID blank for trial purposes, but for heavy use, register for your own personal Yahoo! Application ID, see: http://developer.yahoo.com/geo/placefinder/ 34
Aggregate by Country Aggregate Data was selected. Implementer(s): Chintan Tank Documentation: http://wiki.cns.iu.edu/display/CISHELL/Aggregate+Data Input Parameters: Aggregate on column: Country Delimiter for Country: | Longitude: AVERAGE Latitude: AVERAGE Times Cited: SUM Aggregated by '': All rows of Latitude column were skipped due to no non-null, non-empty values. Aggregated by '': All rows of Longitude column were skipped due to no non-null, non-empty values. Frequency of unique "Country" values added to "Count" column. 35
Choropleth Map Right-click and Save map as PostScript file. Use PostScript Viewer or convert to pdf to view. 36
Reading the Choropleth Map Header shows visualization type, data description, and creation date Legend shows how data matches up with visual representation 37
Proportional Symbol Map Right-click and Save map as PostScript file. Use PostScript Viewer or convert to pdf to view. 38
Reading the Proportional Symbol Map Header shows visualization type, data description, and creation date Legend shows how data matches up with visual representation 39
Relevant Sci2 Manual entry http://wiki.cns.iu.edu/display/SCI2TUTORIAL/5.2.4+Mapping+Scientometrics+%28ISI+Data%29 40
2p Welcome and Overview of Tutorial and Attendees 2:15p Sci2 Tool Hands-on Download and run the Sci2 Tool Temporal Analysis: Horizontal line graph of NSF projects Geospatial Analysis: US and world maps Geospatial Analysis: Geomap with network overlays Topical Analysis: Visualize research profiles Network Analysis: Co-occurrence networks and bimodal networks Network Analysis: Evolving collaboration networks 3:15p Outlook and Q&A 3:30p Adjourn Tutorial Overview 41
Geomap with Gephi Network Overlay See 4.7.6 on http://sci2.wiki.cns.iu.edu File with geolocations and linkage info, e.g., an isibiblio-graphy file. Use Yahoo! Geocoder to identify Latitude, Longitude for each geolocation Extract attributes per geolocation, e.g., total times cited (TC) Extract linkages and their attributes, e.g., number of co-occurences See sample /geo/LaszloBarabasiGeo.net with co-occurrence of “Research Addresses” and full counting of TC per geolocation. Read into Sci2 Tool to generate geomap and network file Layout network in Gephi Combine geomap and network in Photoshop + = 42
Relevant Sci2 Manual entry http://sci2.wiki.cns.iu.edu/display/SCI2TUTORIAL/4.7+Geospatial+Analysis+%28Where%29#4.7GeospatialAnalysis%28Where%29-4.7.6UsingGephitoRenderNetworksOverlaidonGeoMaps 43
Use Sci2 Tool to Generate Geomapand Network File Read prepared .net file and run: Save map file as Postscript file and use Adobe or other view to read. It looks like: Save .net file as GraphML (Prefuse) and rename to .graphml so that Gephi can read it. 44
Use Gephito Generate Network Layout Start gephi. Use New Project > Open a graph file to read .graphmlfile that Sci2 generated. Follow instructions in online tutorial on Manipulating the Network File in Gephi 45
Use Gephi to Generate Network Layout Color or size code the “Near Alaska” and “Near Antarctica” anchor nodes to ease alignment of geomap and network overlay, see instructions in online tutorial on Manipulating the Network File in Gephi. Save result using File > Export > SVG/PDF file. 46
Use Photoshop to Overlay Network on Geomap Load geomap and network files into Photoshop. Select ‘network’ layer an use ‘Right click, Duplicate Layer’ to copy network over to ‘geomap’ file as a second layer. Use Edit > Transform > Scale’ and align using the “Near Antarctica” anchor nodes, see instructions in online tutorial on Creating the Visualization in Photoshop. 47
Practice these steps using “LaszloBarabasi-collaborations.net” linked from Sci2 wiki: 4.7.6 Using Gephi to Render Networks Overlaid on GeoMaps Rounded edges might increase legibility of overlapping lines. 50