Download
1 / 49
490 likes | 525 Vues
Chapter Two. Cost Behavior, Operating Leverage, & Profitability Analysis. Cost Behavior. Manner in which a cost changes as a related activity changes. Classifications of Cost Behavior Variable Costs Fixed Costs Mixed Costs. Cost Behavior.

E N D
Chapter Two Cost Behavior, Operating Leverage, & Profitability Analysis
Cost Behavior • Manner in which a cost changes as a related activity changes. • Classifications of Cost Behavior • Variable Costs • Fixed Costs • Mixed Costs
Cost Behavior • Behavior is relative to the context it is presented in • The term fixed or variable is based on the total cost.
Summer Vacation • Let’s say you and 2 friends are going to Cabo for 4 nights. • You are going to fly down there and stay in a hotel. • The hotel charges $100 per night regardless of how many people stay in the room. • TOTAL Expected Lodging Cost = $400
Two days before you leave one more friend decides to come along. • How does this affect your hotel bill? • No change – total lodging is still $400 • This is a fixed cost – The total cost does not change.
The day before you leave one friend gets sick and can’t go. • What happens to your hotel bill now? • No Change • This is a fixed cost – The total cost does not change
How does all this affect you? • Total Hotel Bill = $400 • How much do you have to pay? Fixed Cost Behavior
What about the airfare? • You were able to get plane tickets for $200 roundtrip per person. Variable Cost Behavior
Under a variable cost structure the cost per unit stays the same and the total cost changes • Using the Variable Cost Structure avoids Fixed Cost Risk
Whether a cost is fixed or variable depends on the underlying circumstances. • Let’s look back at our lodging for vacation. • What if we decide to stay 5 nights instead of 4? • What if we come home a day early?
Here the lodging is a variable cost. • The cost per night stays the same and the total cost changes.
Relevant Range • What happens if three more friends decide to come along and you have a total of 6 people? • You will more than likely have to rent 2 rooms each night. • Now your total lodging is $200 per night. • The structures work within a relevant range. • Our range here is 1 to 4 people.
When the activity level increases, total fixed costs • Increases • Decreases • Remains constant
When the activity level increases, fixed cost per unit • Increases • Decreases • Remains constant
When the activity level increases, variable cost per unit • Increases • Decreases • Remains constant
When the activity level increases, total variable costs • Increases • Decreases • Remains constant
Mixed Cost • Has characteristics of both a variable and a fixed cost. • e.g. – Copy machine lease • Cost = $1,000 per month • Plus $1 for every copy over 2,000
Art on Tour, Inc. (AOTI) • Art on Tour Inc. contracts with artists to exhibit their works to the public. AOTI has agreed to pay a well known artist a $20,000 commission for the right to exhibit his work for one month. • We need to determine the total commission cost and the commission cost per person if 1,000 / 2,000 / 4,000 people attend the exhibition.
Is this commission cost fixed or variable? • Fixed – Total cost does not change
AOTI provides patrons with books illustrating the artist’s work. • The books cost AOTI $5 each. • We need to determine the total cost of books and the cost per person if 1,000 / 2,000 / 4,000 people attend.
AOTI expects 4,000 people to attend the exhibition and the tickets are $6 each. • AOTI decided not to give the attendees a book. • Let’s prepare an income statement Revenue ($6 / ticket) $ 24,000 Commission Cost (20,000) Net Income $ 4,000
10% 10% • What if actual attendance is 10% higher or lower than expected? # of People 3600 4000 4400 Revenue $21,600 $24,000 $26,400 Commission (20,000)(20,000)(20,000) Net Income $ 1,600 $ 4,000 $ 6,400 *Alt. Measure – Base Measure = Difference Difference / Base Measure = % Change 60% 60%
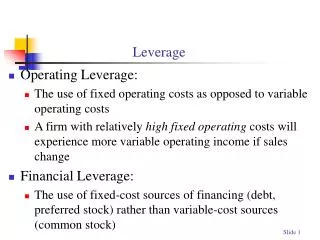
Operating Leverage • Magnifies small changes in revenue into dramatic changes in profitability • The Lever = Fixed Cost
Risk vs. Reward • Risk – refers to the possibility that sacrifices may exceed benefits • What if no one comes to the exhibition?
What if we change the way we pay the commission? • Now we pay $5 in commission per person attending the exhibition. # of People 1 2000 4000 Revenue $6 $12,000 $24,000 Commission (5)(10,000) (20,000) Net Income $1 $ 2,000 $ 4,000
Using Fixed Cost to Provide a Competitive Operating Advantage • My Company and Your Company provide rafting tours on Big Bear River. My Company pays tour guides fixed salaries. It budgets salaries expense at $160,000 per year. Your Company pays tour guides $40 per rafter served. Rafters are charged $50 per tour. Both companies expect to carry approx. 4,000 rafters during the year.
Let’s look at an Income Statement for each Company My Co. Your Co. Revenue ($50 * 4,000) $200,000 $200,000 Salary Exp. 160,000 160,000* Net Income $ 40,000 $ 40,000 * $40 * 4,000
In an effort to lure rafters away from Your Company, My Company lowers the price per rafter to $39. • Now My Company serves 6,000 rafters who each pay $39 per tour. • Your Company serves only 2,000 rafters who pay $50 per tour.
Income Statement My Co. Your. Co. Revenue($39*6000)$234,000($50*2000)$100,000 Salary Exp. ( 160,000)($40*2000)( 80,000) Net Income $ 74,000 $ 20,000
Now let’s say Your Company lowered its price to $39 per rafter and lured 2,000 rafters from My Company that is still charging $50 per rafter. Income Statement My Co.Your Co. Revenue ($50*2000) $100,000 ($39*6000)$234,000 Salary Exp. ( 160,000)($40*6000)( 240,000) Net Income ($ 60,000) ($ 6,000)
What should My Company do? • My Company matches the $39 price set by Your Company. • Now they each serve 4,000 customer Income Statement MY CO.YOUR CO. Revenue $156,000 $156,000 Salary Exp. ( 160,000)( 160,000) Net Income ($ 4,000) ($ 4,000)
Using Fixed Cost to Provide a Competitive Operating Advantage I suppose fixed costs arebetter if volume is increasing,but variable costs may be betterif business is declining.
Cost Behavior Summarized Your monthly basic telephone bill is probablyfixedand does not change when you make more local calls. Total Fixed Cost Monthly Basic Telephone Bill Number of Local Calls
Cost Behavior Summarized The fixedcost per local call decreasesas more local calls are made. Fixed Cost Per Unit Monthly Basic Telephone Bill per Local Call Number of Local Calls
Cost Behavior Summarized Your total long distance telephone bill is based on how many minutes you talk. Total Long DistanceTelephone Bill Total Variable Cost Minutes Talked
Cost Behavior Summarized The cost per minute talked is constant.For example, 10 cents per minute. Variable Cost Per Unit Per MinuteTelephone Charge Minutes Talked
Cost Behavior Summarized When activity level changes . . .
Contribution Margin • CM = Revenue – Variable Costs • CM represents the amount available to cover fixed expenses and thereafter provides profits.
Sharon Virgil owns a delivery service company. She charges customers $10 per delivery. The company’s variable expenses average $2 per delivery and fixed costs are $600 per month. Sharon provided 100 deliveries during January.
Contribution MarginIncome Statement Revenue$ 1,000 (Variable Costs) ( 200) Contribution Margin $ 800 (Fixed Costs)( 600) Net Income $ 200
Measuring Operating LeverageUsing Contribution Margin • Operating Leverage = Contribution Margin Net Income • OL = $800 / $200 = 4 • What does this 4 tell us? • If you take the OL and multiply it by the % increase in sales it gives you the % increase in net income. • Let’s say deliveries increase 10% for February. • 4 * 10% = 40% in net income
Let’s test our theory! • In February sales increased by 10% • 100 deliveries * 110% = 110 deliveries Revenue $1,100 (Variable Costs)( 220) Contribution Margin 880 (Fixed Costs)( 600) Net Income $ 280
Sharon made 10 more deliveries in February. • Sales rose from $1,000 to $1,100 • This is a 10% increase • Net income rose from $200 to $280 • This is a 40% increase • % change = (280 – 200) = 80 80 / 200 = 40%
High Low Method • Used to estimate future costs Step 1: Assemble Sales Volume and Cost History Step 2: Find High and Low Points Step 3: Determine the estimated variable cost per unit Step 4: Determine the estimated total fixed costs
HIGH HIGH LOW LOW
Step 3 (High Cost – Low Cost) = VC per unit (High Units – Low Units) (450,000 – 145,000) = $12,200 / unit (35 – 10)
Step 4 FC + VC = Total Cost FC = TC – VC FC = $450,000 – (35 * $12,200) FC = $450,000 – 427,000 FC = $23,000