Linkage Disequilibrium
530 likes | 885 Vues
Linkage Disequilibrium. Joe Mychaleckyj Center for Public Health Genomics 982-1107 jcm6t@virginia.edu . Today we’ll cover…. Haplotypes Linkage Disequilibrium Visualizing LD HapMap. References. Principles of Population Genetics, Fourth Edition (Hardcover) by Daniel L. Hartl,

Linkage Disequilibrium
E N D
Presentation Transcript
Linkage Disequilibrium Joe Mychaleckyj Center for Public Health Genomics 982-1107 jcm6t@virginia.edu
Today we’ll cover… • Haplotypes • Linkage Disequilibrium • Visualizing LD • HapMap
References Principles of Population Genetics, Fourth Edition (Hardcover) by Daniel L. Hartl, Andrew G. Clark (Author) Genetic Data Analysis II Bruce S Weir x x x
References Statistical Genetics: Gene Mapping Through Linkage and Association Eds Benjamin M. Neale, Manuel A.R. Ferreira, Sarah E. Medland, Danielle Posthuma
2N (ie very large diversity possible) SNP1 SNP2 SNP3 [A / T] [C / G] [A / G] ACG ACA TGG Haplotype: specific combination of alleles occurring (cis) on the same chromosome (segment of chromosome)N SNPs - How many Haplotypes are possible ?
Terminology • Haplotype: Specific combination (phasing) of alleles occurring (cis) on the same chromosomal segment • Linkage/Linked Markers: Physical co-location of markers on the same chromosome • Diplotype: Haplogenotype ie pair of phased haplotypes one maternally, one paternally inherited
SNP1 [ A / a ] SNP2 [ B / b ] Major Allele Freq: p(A) p(B) Minor Allele Freq: p(a) p(b) Independently segregating SNPs: Haplotype Frequency p(ab) = p(a) x p(b) LINKAGE EQUILIBRIUM (How many haplotypes in total ?) LINKAGE DISEQUILIBRIUM Haplotype Frequency p(ab)≠ p(a) x p(b)
Linkage Disequilibrium • Non-random assortment of alleles at 2 (or more) loci • The closer the markers, the stronger the LD since recombination will have occurred at a low rate • Markers co-segregate within and between families
* LINKAGE EQUILIBRIUM * Not a Punnett Square! SNP2 Allele B b SNP1 Allele A a p(A)p(B) p(a)p(B) p(A)p(b) p(A) p(a)p(b) p(a) p(B) p(b) Example: p(A)p(B)+p(a)p(B)=p(B){ p(A)+p(a)} = p(B)
SNP1 [ A / a ] SNP2 [ B / b ] Major Allele Freq: p(A) p(B) Minor Allele Freq: p(a) p(b) LINKAGE DISEQUILIBRIUM Haplotype Frequency p(ab) = p(a) p(b) + D (sign of D is generally arbitrary, unless comparing D values between populations or studies) D: Lewontin’s LD Parameter (Lewontin 1960)
* LINKAGE DISEQUILIBRIUM * SNP2 Allele B b SNP1 Allele A a p(A)p(B)+D p(a)p(B)-D p(A)p(b)-D p(A) p(a)p(b)+D p(a) p(B) p(b) p(A)p(B)+D + p(a)p(B)-D =p(B){ p(A)+p(a)} = p(B)
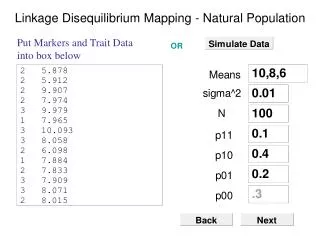
b B What is the LD ? ≠ 0 p(ab) ≠ p(a) p(b) 0.16 0.04 p(a)=0.20 a A p(B)=0.80 0.14 0.66 p(b)=0.30 p(B)=0.70 p(ab) = p(a) p(b) + D 0.16 = 0.2 x 0.3 + D D = 0.1 Since p(ab) = p(a)p(b)+ D +D was used and D is +ve here, but arbitrary eg can relabel alleles A,B as minor
Range of D values (-ve to +ve) D has a minimum and maximum value that depends on the allele frequencies of the markers Since haplotype frequencies cannot be -ve p(aB) = p(a)p(B) - D ≥ 0 D ≤ p(a)p(B) p(Ab) = p(A)p(b) - D ≥ 0 D ≤ p(A)p(b) These cannot both be true, so D ≤ min( p(a)p(B), p(A)p(b) ) p(ab) = p(a)p(b) + D ≥ 0 D ≥ -p(a)p(b) p(AB) = p(A)p(B) + D ≥ 0 D ≥ -p(A)p(B) These cannot both be true, so D ≥ max( -p(a)p(b), -p(A)p(B) ) * Similar equations if we had defined p(ab) = p(a)p(b) - D
Limits of D LD Parameter Limits of D are a function of allele frequencies Standardize D by rescaling to a proportion of its maximal value for the given allele frequencies (D') D’ = D Dmax
D’ (Lewontin, 1964) D’ = D / Dmax Dmax = min (p(A)p(B), p(a)p(b)) D < 0 Dmax = min (p(A)p(b), p(a)p(B)) D > 0 Again, sign of D’ depends on definition D’ = 1 or -1 if one of p(A)p(B), p(A)p(b), p(a)p(B), p(a)p(b) = 0 = Complete LD (ie only 3 haplotypes seen) D’=1 or -1 suggests that no recombination has taken place between markers Beware rare markers - may not have enough power/sample size to detect 4th haplotype
D’ Interpretation b B b B 0.06 0.14 p(a)=0.20 0.2 0 p(a)=0.20 a A a A p(A)=0.80 0.7 P(A)=0.80 0.1 0.56 0.24 p(b)=0.30 p(B)=0.70 p(b)=0.30 p(B)=0.70 D=0 ; Dmax undefined D=Dmax =0.14 ; D’ = +1 p(a) = 0.2 p(b)= 0.3 D’=1 (perfect LD using D’ measure - No recombination between marker - Only 3 haplotypes are seen
Creation of LD • Easiest to understand when markers are physically linked • Creation of LD • Mutation • Founder effect • Admixture • Inbreeding / non-random mating • Selection • Population bottleneck or stratification • Epistatic interaction • LD can occur between unlinked markers • Gametic phase disequilibrium is a more general term
SNP1 SNP2 A B A b n=4 haplotypes a B a b SNP1 SNP1 SNP2 n=3 haplotypes A B A Recombination n=2 haplotypes A b a B a
Destruction of LD • Main force is recombination • Gene conversion may also act at short distances (~ 100-1,000 bases) • LD decays over time (generations of interbreeding)
SNP1 SNP2 Probability Recombination occurs = θ Probability Recombination does not occur = 1-θ Initial LD between SNP1 - SNP2: D0 After 1 generation Preservation of LD: D1 = D0(1-θ) After t generations: Dt = D0 (1- θ)t NB: Overly simple model - does not account for allele frequency drift over time
r2 LD Parameter (Hill & Robertson, 1968) r2 = D2 p(a)p(b)p(A)p(B) • Squared correlation coefficient varies 0 - 1 • Frequency dependent • Better LD measure for allele correlation between markers - predictive power of SNP1 alleles for those at SNP2 • Used extensively in disease gene or phenotype mapping through association testing
r2 Interpretation b B b B 0.06 0.14 p(a)=0.20 0.2 0 p(a)=0.20 a A a A p(A)=0.80 0.7 p(A)=0.80 0.1 0.56 0.24 p(b)=0.30 p(B)=0.70 p(b)=0.30 p(B)=0.70 D=0 ; Dmax undefined D=Dmax =0.14 ; D’ = +1 r2 = 0 r2 = 0.14/0.24 = 0.58 p(a) = 0.2 p(b) = 0.3 r2 ≠ 1 Correlation is not perfect, even though D’ = 1 r2 = 1 if D’ = 1 and p(a)= p(b) = 0.3
r2 Interpretation p(a) = 0.3 p(b) = 0.3 Only 2 haplotypes: r2 = 1 Correlation is perfect D’ =1 (less than 4 haplotypes) p(a)= p(b) (= 0.3 in this example) • r2=1 when there is perfect correlation between markers and one genotype predicts the other exactly • Only 2 haplotypes present • D’ = 1 ≠> r2 = 1 • No recombination AND markers must have identical allele frequency • SNPs are of similar age • Corollary • Low r2 values do not necessarily = high recombination • Discrepant allele frequencies
Common Measures of Linkage Disequilibrium -1 D’ 1 0 r2 1 Recombination Correlation Other LD Measures exist, less common usage
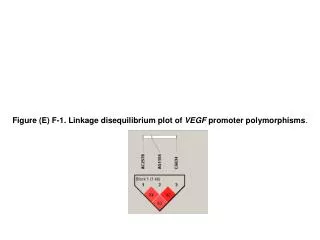
SNP 1 2 3 4 5 6 | D’ | SNP1 SNP2 SNP3 SNP4 SNP5 SNP6 1.0 0.8 0.6 0.2 0 Not usually worried about sign of D’
http://www.hapmap.org Launched October 2002
International HapMap Project • Initiated Oct 2002 • Collaboration of scientists worldwide • Goal: describe common patterns of human DNA sequence variation • Identify LD and haplotype distributions • Populations of different ancestry (European, African, Asian) • Identify common haplotypes and population-specific differences • Has had major impact on: • Understanding of human popualtion history as reflected in genetic diversity and similarity • Design and analysis of genetic association studies
HapMap samples • 90 Yoruba individuals (30 parent-parent-offspring trios) from Ibadan, Nigeria (YRI) • 90 individuals (30 trios) of European descent from Utah (CEU) • 45 Han Chinese individuals from Beijing (CHB) • 44 Japanese individuals from Tokyo (JPT)
Project feasible because of: • The availability of the human genome sequence • Databases of common SNPs (subsequently enriched by HapMap) from which genotyping assays could be designed • Development of inexpensive, accurate technologies for highthroughput SNP genotyping • Web-based tools for storing and sharing data • Frameworks to address associated ethical and cultural issues
HapMap goals • Define patterns of genetic variation across human genome • Guide selection of SNPs efficiently to “tag” common variants • Public release of all data (assays, genotypes) • Phase I: 1.3 M markers in 269 people 1 SNP/5kb (1.3M markers) Minor allele frequency (MAF) >5% • Phase II: +2.8 M markers in 270 people
HapMap publications • The International HapMap Consortium. A Haplotype Map of the Human Genome. Nature 437, 1299-1320. 2005. • The International HapMap Consortium. The International HapMap Project.Nature 426, 789-796. 2003. • The International HapMap Consortium. Integrating Ethics and Science in the International HapMap Project. Nature Reviews Genetics 5, 467 -475. 2004. • Thorisson, G.A., Smith, A.V., Krishnan, L., and Stein, L.D. The International HapMap Project Web site.Genome Research,15:1591-1593. 2005.
ENCODE project • Aim: To compare the genome-wide resource to a more complete database of common variation—one in which all common SNPs and many rarer ones have been discovered and tested • Selected a representative collection of ten regions, each 500 kb in length • Each 500-kb region was sequenced in 48 individuals, and all SNPs in these regions (discovered or in dbSNP) were genotyped in the complete set of 269 DNA samples
Comparison of linkage disequilibrium and recombination for two ENCODE regions Nature 437, 1299-1320. 2005
Haplotype Blocks N SNPs = 2N Haplotypes possible, ie very large diversity possible But: we do not see the full extent of haplotype diversity in human populations Extensive LD especially at short distances eg ~20kbases. Haplotypes are broken into blocks of markers with high mutual LD separated by recombination hotspots Non-uniform LD across genome
Haplotype Blocks Haplotype blocks: at least 80% of observed haplotypes with frequency >= 5% could be grouped into common patterns Whole Genome Patterns of Common DNA Variation in Three Human Populations, Science 2005, Hinds et al.
Example: Large block of LD on chromosome 17 Cluster of common (frequent SNPs In high LD) 518 SNPs, spanning 800 kb 25% in EUR, 9% in AFR, missing in CHN Genes: Microtubule-associated protein tau Mutations associated with a variety of neurodegeneartive disorders Gene coding for a protease similar to presenilins Mutations result in Alzheimer’s disease Gene for corticotropin-releasing hormone receptor Immune, endocrine, autonomic, behavioral response to stress
Chromosome 17 LD Region Prevalent inversion in EUR human population ~25%