Download
1 / 15
150 likes | 235 Vues
Explore the efficiency of combining information in markets through IA distribution and performance calculations using Bayesian methods. Discover the mechanism, market maker impact, and overall market value. Evaluate performance across periods and price dynamics using KL measures. Learn about rational share-info estimates in various situations.

E N D
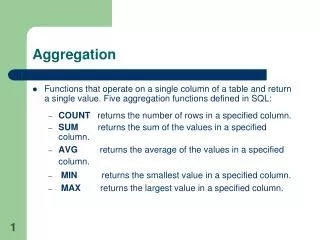
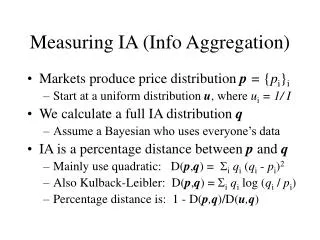
Measuring IA (Info Aggregation) • Markets produce price distribution p = {pi}i • Start at a uniform distribution u, where ui= 1/ I • We calculate a full IA distribution q • Assume a Bayesian who uses everyone’s data • IA is a percentage distance between p and q • Mainly use quadratic: D(p,q) = iqi (qi - pi)2 • Also Kulback-Leibler: D(p,q) = iqi log (qi / pi) • Percentage distance is: 1 - D(p,q)/D(u,q)
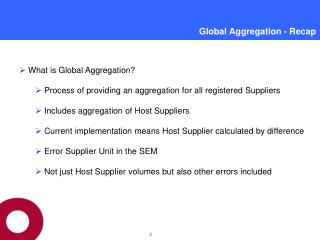
Mechanism Performance Market Maker Combined Value Standard 1 0 -1 1 0 -1 3 vars IA 87%11% 69%38% 27%63% 1 2 3 4 5 6 1 2 3 4 5 6 1 2 3 4 5 6 1 0 -1 1 0 -1 8 vars 26%17% 22%23% 3%5% Period
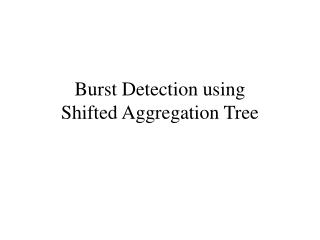
Performance – All Data Market Maker Combined Value Standard 1 0 -1 1 0 -1 3 vars IA 70%36% 68%36% 27%63% 1 2 3 4 5 6 1 2 3 4 5 6 1 2 3 4 5 6 1 0 -1 1 0 -1 8 vars 26%17% 18%20% 3%5% Period
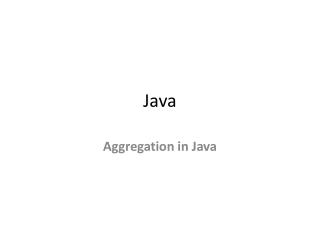
Performance – KL Measure Market Maker Combined Value Standard 1 0 -1 1 0 -1 3 vars IA 71%22% 29%105% 4%50% 1 2 3 4 5 6 1 2 3 4 5 6 1 2 3 4 5 6 1 0 -1 1 0 -1 8 vars 23%17% -15%60% 5%8% Period
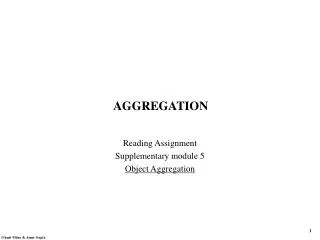
Performance – KL, All Data Market Maker Combined Value Standard 1 0 -1 1 0 -1 3 vars IA 56%40% 27%103% 4%50% 1 2 3 4 5 6 1 2 3 4 5 6 1 2 3 4 5 6 1 0 -1 1 0 -1 8 vars 23%17% -12%50% 5%8% Period
Price Dynamics - KL Market Maker Combined Value 1 0 -1 1 0 -1 3 vars IA 0 5 10 15 1 2 3 4 1 0 -1 1 0 -1 8 vars Minutes Round
Situations: Goals, Training (Actually: X Z Y ) • Want in Situation: • explainable, fast, neutral • many variables, few directly related • few people, each not see all data cases • compute rational share-info estimates • Training Situation: • 3 binary variables X,Y,Z, 23 = 8 combos • P(X=0) = .3, P(X=Y) = .2, P(Z=1)= .5 • 3 people, see 10 cases of: AB, BC, AC • random map XYZ to ABC Case A B C 1 1 - 1 2 1 - 0 3 1 - 0 4 1 - 0 5 1 - 0 6 1 - 1 7 1 - 1 8 1 - 0 9 1 - 0 10 0 - 0 Sum: 9 - 3 Same A B C A -- -- 4 B -- -- -- C -- -- --
Test Situation (Really: W V X S U Z Y T ) • 8 binary var. STUVWXYZ • 28 = 256 combos • .2 = P(S=0) = P(S=T) = P(T=U) = P(U=V) = … = P(X=Y) = P(Y=Z) • 6 people, see 10 cases of: ABCD, EFGH, ABEF, CDGH, ACEG, BDFH • random map STUVWXYZ to ABCDEFGH Case A B C D E F G H 1 0 1 0 1 - - - - 2 1 0 0 1 - - - - 3 0 0 1 1 - - - - 4 1 0 1 1 - - - - 5 0 1 1 1 - - - - 6 1 0 0 1 - - - - 7 0 1 1 1 - - - - 8 1 0 0 1 - - - - 9 1 0 0 1 - - - - 10 1 0 0 1 - - - - Sum: 6 3 4 10 - - - - Same A B C D E F G H A -- 1 2 6 -- -- -- -- B -- -- 7 3 -- -- -- -- C -- -- -- 4 -- -- -- -- D -- -- -- -- -- -- -- -- …
B A f1>1 f2<1 Prices + + q1 $1 if A&B - - q2 $1 if B User Assets A Simple Implementation States
A&B A&B A Simple Implementation States Prices User Assets
D A C G F B E H A Scaleable Implementation • Overlapping variable patches • A simple MSR for each patch • Arbitrage neighbor patches • Limits profits to users who find inconsistencies • Only allow trade if all vars in same patch? • User assets per patch, move via overlap • Regroup patches from request activity?
A B C B C .065 1.000 B B A A .9 .734 .2 .1 B C .4 .6 Cash extracted Arbitraging Patches .02 .08 .3 .1 .2 .7 .3 .3
A B C B A B B A B C C .214 .786 .214 .786 .786 Arbitraging Patches .043 .171 .214 .160 .053 .175 .611 .393 .393
A B C C 1 0 0 A 2 B A C B B B Moving Assets Between Patches 1 0 2 1 3 2 0 4
A B C C 0 0 2 1 A C B A B B 1 B Moving Assets Between Patches 2 1 1 0 3 2 0 4