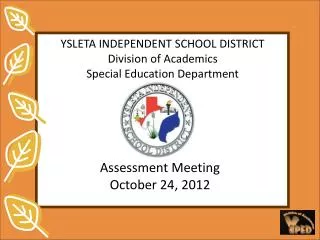
Assessment Dashboard October 2012
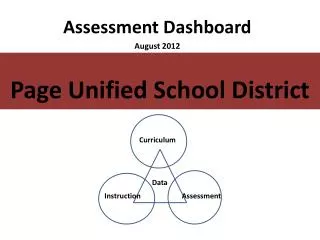
Assessment Dashboard October 2012. Page Unified School District. Curriculum. Data. Instruction. Assessment. Galileo Standards Assessed. Common Core Standards Aligned with 1 st Quarter Curriculum Reading Grades 1-8 & 11-12 Math Grades 1-8 & Algebra I, Algebra II, Geometry

Assessment Dashboard October 2012
E N D
Presentation Transcript
Assessment Dashboard • October 2012 Page Unified School District Curriculum Data Instruction Assessment
Galileo Standards Assessed • Common Core Standards Aligned with 1st Quarter Curriculum • Reading Grades 1-8 & 11-12 • Math Grades 1-8 & Algebra I, Algebra II, Geometry • 2003 AZ Reading Standards Aligned with 1st Quarter Curriculum • Reading Grades 9 & 10 • 2005 AZ Science Standards Aligned with 1st Quarter Curriculum • Science Grades 6-8 & Earth and Space, Biology, Chemistry, and Physics
Galileo High School Data Statements Areas of Strength Areas of Concern 52% of Algebra I students are on track to meet or exceed the standards. 22% of HS Biology Students are on track to meet or exceed the standards. • 78% of HS Algebra II students are on track to meet or exceed the standards. This is a 9% increase from the pre-assessment. • 77% of 11th Graders are on track to Meet or Exceed the standard. This is a 5% increase from the pre-assessment.
Galileo Middle School Data Statements Areas of Strength Areas of Concern 53% of 6th grade students are on track to meet or exceed the math standards. This is 6% decrease from the pre-assessment. 48% of 8th grade students are on track to meet or exceed the math standards. There was no change from pre-assessment • 63% of 8th graders are on track to meet or exceed the Science standards. This is a 3% increase from the pre-assessment. • 75% of 7th grade students are on track to meet or exceed the reading standards. This is a 13% increase from the pre-assessment.
Galileo & DIBELS Desert ViewData Statements Areas of Strength Areas of Concern 45% of 5th grade students are on track to meet or exceed the standards in mathematics. This is a 1% increase from the pre-assessment 39% of 4th grade students are at benchmark on the DIBELS October Progress Monitoring test. • 64% of 5th graders are on track to meet or exceed the reading standards. This is a 5% increase from the pre-assessment • 58% of 3rd graders are on track to meet or exceed the reading standards. • 22% of 5th graders are in need of Intensive Support for reading fluency. This is a 15% drop from the beginning DIBELS test.
Galileo & DIBELS Lake ViewData Statements Areas of Strength Areas of Concern 50% of kindergarteners are in need of intensive support for Correct Letter Sounds on the DIBELS progress monitoring assessment. 46% of 2nd grade students are on track to be below standard for math. • 57% of 1st graders are on track to meet or exceed the Math standards. This is a 3 % increase from the pre-assessment. (54%) • 55% of 2nd graders are on track to meet or exceed the reading standards. This is a 5% increase from the pre-assessment