Download
1 / 19
210 likes | 441 Vues
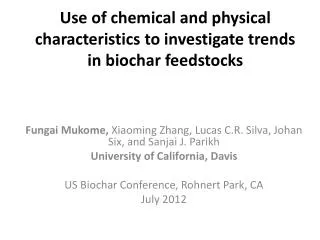
Use of chemical and physical characteristics to investigate trends in biochar feedstocks. Fungai Mukome, Xiaoming Zhang, Lucas C.R. Silva, Johan Six, and Sanjai J. Parikh University of California, Davis US Biochar Conference, Rohnert Park, CA July 2012. What is Biochar?. Walnut shell.

E N D
Use of chemical and physical characteristics to investigate trends in biochar feedstocks Fungai Mukome, Xiaoming Zhang, Lucas C.R. Silva, Johan Six, and Sanjai J. Parikh University of California, Davis US Biochar Conference, Rohnert Park, CA July 2012
What is Biochar? Walnut shell Wood chips Rice Husks Manure Corn stover Orange peels Fly ash carbon-negative.us Wood
All biochars are not created equal…. (McLaughlin et al. 2009) • Differ on • pH • Surface area • Ash content • Water holding capacity • Cation exchange capacity (CEC) • H/C ratio • C/N ratio • All a function of pyrolysis temperature (highest treatment temperature-HTT), pyrolysis method, residence time and feedstock
Objectives • To characterize physical and chemical properties of various biochars (mostly commercially available) • To determine if trends exist for biochar properties that can be related to feedstock material, which can serve to develop guidelines for biochar use.
Objectives 1 Twelve biochars were analyzed • Physical properties: • Moisture content • Ash content • BET Surface area • Surface morphology • Chemical properties: • Elemental content • H and C content • pH • Cation exchange capacity • Surface basicity and acidity • Surface functionality (ATR-FTIR and Raman)
Physical properties • aPs.II = Pseudo Type II • bUnknown, not willing to provide or proprietary cNot commercially available Wood Non-wood
a) BC_G • b) BC_F • c) BC_B 60µm 100µm 10µm SEM images of three biochars showing a) a char with type H3 hysteresis loop b) a char with type H4 hysteresis loop and c) a char with high ash content. Scanning Electron Microscopy analysis Type II isotherms - capillary non-porous or macroporous adsorbents and represent monolayer-multilayer adsorption. Lowersurface areas (BC_J,BC_H, BC_A and BC_G) - Type H3 hysteresis loops - lack of microporosity, plate-like particles and slit shaped pores. Highersurface area - (BC_L, BC_K, BC_J, BC_I, BC_F) - Type H4 hysteresis loops- narrow slit-like pores
Chemical properties • aCEC = Cation exchange capacity b Not commercially available Wood Non-wood
FTIR: Fourier Transform Infrared Spectroscopy Aromatic C=C C-H Aliphatic/Functionalized C-O, C-H C-O C=O Greater aromaticity in wood derived biochar
y. Ratio of peak intensities of the Carbon D (1350cm-1) and G (1690cm-1) bands in Raman spectra D band (aromatic) G band (aliphatic & olefinic)
van Krevelen diagram of a) selected biochar (from literature) and b) 12 study biochar (inset) Objective 2 1. Sharma et al. Fuel 2004,83, 1469-1482. 2. Keiluweit et al. Environmental Science & Technology 2010,44, 1247-1253. 3. Zheng et al. Journal of Hazardous Materials 2010,181, 121-126. 4. Cao, X. et al. BioresourceTechnology 2010,101, 5222-5228. 5. Özçimen et al. Renewable Energy 2010,35, 1319-1324. 6. Jindarom et al. Chemical Engineering Journal 2007,133, 239-246. 7. Chan et al. Soil Research 2008,46, 437-444. 8. Azargoharet al. Applied Biochemistry and Biotechnology 2006,131, 762-773. 9. Wuet al. Industrial & Engineering Chemistry Research 2009,48, 10431-10438. 10. Toles et al. BioresourceTechnology 2000,71, 87-92. 11. Van Zwieten et al. Plant and Soil 2010,327, 235-246. 12. Chen, B. and Chen, Z. Chemosphere 2009,76, 127-133. 13. Major et al. Plant and Soil 2010,333, 117-128. 14. Argudo, M. et al. Carbon 1998,36, 1027-1031. 15. Hammeset al. Applied Geochemistry 2008,23, 2113-2122. 16. Chun et al. Environmental Science & Technology 2004,38, 4649-4655. 17. Mahinpey et al. Energy & Fuels 2009,23, 2736-2742. 18. Rondon et al. Biology and Fertility of Soils 2007,43, 699-708. 19. Abdullah, H. and Wu, H. Energy & Fuels 2009,23, 4174-4181. 20. Cheng, C.-H and Lehmann, J. Chemosphere 2009,75, 1021-1027. 21. Spokas et al. Chemosphere 2009,77, 574-581. 22. Steiner et al. J. Environ. Qual. 2009,39, 1236-1242. 23. Busscher et al. Soil Science 2010,175, 10-14. 24. Brewer et al. Environmental Progress & Sustainable Energy 2009,28, 386-396. 25. Novak et al. Annals of Environmental Science 2009,3, 195-206. 26. Novak, J. M. and Reicosky, D. C. Annals of Environmental Science 2009,3, 179-193. 27. Singh et al. J. Environ. Qual. 2010,39, 1224-1235. A algae G grass L hull M manure N nutshell P pomace W wood n= 85
Change in ash content as a function of pyrolysis temperature of biochar Change in ash content as a function of pyrolysis temperature of biochar derived from hard and softwood
Change in the C/N ratio as a function of pyrolysis temperature of biochar Change in the C/N ratio as a function of pyrolysis temperature of biochar derived from hard and softwood.
Change in the surface area as a function of pyrolysis temperature of biochar Change in surface area as a function of pyrolysis temperature of biochar derived from hard and softwood
Box plots showing differences in a) ash content and b) C/N ratios, but not in c) surface area across the different feedstocks. The grey boxes show the range from first to third quartiles, with the median dividing the interquartile range, into two boxes for the second and third quartiles. Letters show significant differences (p<0.05) according to a one-way ANOVA followed by Tukey (HSD) multiple means comparison
Acknowledgements • Xiaoming Zhang • Lucas C.R. Silva • Johan Six • Sanjai J. Parikh • UC Davis Agricultural Sustainability Institute (ASI) Junior Faculty Award • David and Lucile Packard Foundation • Email:fmukome@ucdavis.edu
Effects of biochar • Improves • water holding capacity • nutrient retention • soil fertility • agricultural yield • greenhouse emission (GHG) mitigation • However many other studies have shown • no increase in crop yields, • increased GHG emissions, • unintended “liming” of soils. • Results often linked to the properties of the biochar used, application rate, soil type and climate.