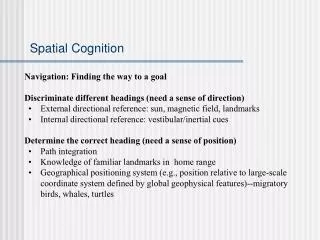
Visuo-spatial Cognition in Autism
Visuo-spatial Cognition in Autism. Lizzie Thomson 1,2 , Dagmara Annaz 3 &. Michael Thomas 3. 2 Department of Human Sciences, Brunel University, UK 3 Department of Psychology, Birkbeck College, University of London, UK. Introduction. Study 2: House Construction. Autism Spectrum Disorder.

Visuo-spatial Cognition in Autism
E N D
Presentation Transcript
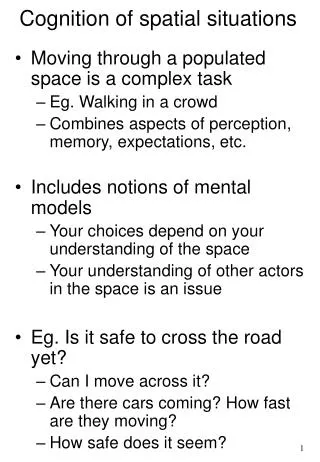
Visuo-spatial Cognition in Autism Lizzie Thomson1,2, Dagmara Annaz3 &.Michael Thomas3 2Department of Human Sciences, Brunel University, UK 3Department of Psychology, Birkbeck College, University of London, UK Introduction Study 2: House Construction Autism Spectrum Disorder PARTICIPANTS • A rare neurodevelopmental disorder that affects approx. 60 in 10,000 children under age of eight (Wing & Potter, 2002). • General social deficit noted, with “triad of deficits” (Wing & Gould, 1979) in socialisation, communication and imagination. • Relative strength noted in piecemeal perception (e.g. Embedded figures test, Jolliffe & Baron-Cohen, 1997). • Overall participant group of 40. • ASD participant group of 25. • All 15 TD children completed all six house completions. METHOD • Physical integration of features in to an image. • Six images of houses from a digital camera (Fujifilm, Finepix A202, taken by L. Thomson, May 2004). • Houses were matched to faces in featural/ configural structure. • Participants were timed while constructing blank house from selection of features (see example right). Perception in Autism: Low Level Processing. Children’s Embedded Figures Test. Block Design Test, • “Weak Central Coherence” theory (e.g. Frith, 2003): • Inability to combine individual features in correct context and perceive in a configural manner. • In this example of materials and set up, the top two features are foils and actual feature is on the bottom. Perception and Construction of an Image. • Strength of replication of perception in • construction noted in autism. • Participant E.C. drawing local-to-global (Mottron & Belleville, 1993). • “Block Design” test without segmentation (Shah & Frith, 1993). RESULTS Face Processing in Autism and the “Other Race Effect”. • Well documented deficit in recognition of “Other Race” when compared to “Same Race” faces at a later date. • Object processing route of “OR” faces results in superior performance in autism for later date recognition (Sasson & Reznick, 2005) • Holistic processing of “SR” and familiar “OR” faces, Tanaka, Kiefer & Bukach (2004). • Feature Selection (FS) and Configural Placement (CP) accuracy increases with age in ASD and TD • (6p = 0.042). • No sig. difference between ASD and TD in FS or CP. PARTICIPANTS • 26 children aged 4- to 12-years (22 males) diagnosed as having an “Autism Spectrum Disorder” (ASD) and who met the CARS (Schopler, Reichler & Rochen, 1993) criteria for high functioning autism. • 15 children (11 males) aged 4- to 12-year were recruited as “Typically Developing” (TD) controls. • Written informed consent was obtained from parents of all children. • ALL 41 children completed various standardised tests to for cognitive and chronological matching for the two groups. CONCLUSION • Developmental trajectories of image construction accuracy is similar in ASD and TD groups. • FS and CP are similar in ASD and TD. For R2 rating: white writing = TD; black writing = ASD. Each beside appropriate trajectory line. 6(F(2,72) = 3.800, p = 0.042, Greenhouse-Geiser) Study 3: Face Processing and The “Other Race Effect” STANDARDISED TESTS FOR ALL PARTICIPANTS • ASD group CARS: 35 (SD=4.2). • BPVS ASD: 80 (SD=12.2), TD: 103 (SD=6.6). • Pattern Construction (BAS) ASD:117 (SD=31.5), TD: 129 (SD=21.2). • Benton Faces SF Standardised score ASD: 38 (SD=6.8), TD: 42 (SD=5.3). • Copying (BAS): ASD 129 (SD=18.6), TD: 138 (SD=21.3). Note: ceiling at 143. • For standardised tests, the 2 groups were well matched for CA (*p=0.108). Cognitive profile shows a deficit in face recognition (BFRT Short-form, *p<0.05), language (*p<0.001) and copying (*p<0.001). However, groups well matched on pattern construction (*p=0.205). PARTICIPANTS • Final ASD participant group was 14. • All 15 children in TD group completed both tasks. • No children were of Oriental Racial origin. METHOD • Discrimination of face images in half-tone (see right for example: Caucasian study - top, and Asian - bottom). • Items 1 – 6: direct matching of front view stimuli picture to one image from the multiple-choice display (choice of six images). • Items 7 – 13: matching of a front view stimulus image with three images from three-quarter views (from six options). • Items 14 – 16: matching of a front view image to three images from different lighting conditions (again, from six options). * Due to CA matching, all standardised test group- level comparisons used ind. t-test. Study 1: Low-level Contour Integration RESULTS • Main interest is in difference between performance of the 2 groups on the 2 tasks. • No sig. difference between the face recognition rates in each test. • No sig. difference between the groups and overall percentage accuracy. • Only Asian test showed sig. improvement with CA (7p <0.05) PARTICIPANTS • 23 of the ASD group participated. • All 15 children in the TD group completed both contour-detection tasks. METHOD • Task Previously used to demonstrate gradual integrative nature of perception in typical development (Kovács, 2000). • Two card-test versions of a contour-detection task were used. One grey-scale using Gabor contour signals (see example) the other using colour to indicate the circles. CONCLUSION • All participants improved Asian, but not Caucasian face detection skills with chronological age. • No significant difference between the groups in face recognition. • One grey-scale using Gabor contour signals (see example) the other using colour to indicate the circles. • Psychophysical indication of one circle per card until inability of circle detection is noted (“threshold”). Circle to detect For R2 rating: white writing = TD; black writing = ASD. Each beside appropriate trajectory line. 7t = 2.138, p <0.05 Summary and Discussion • In a low-level perceptual task, children with ASD demonstrated a preference for featural processing and development of contour integration had a different relationship with CA for the 2 groups. • However, a high-order image reproduction showed similar developmental patterns in ASD and TD groups (according to CA) in featural and configural placement • Face processing tasks did not demonstrate either a “SR/OR” bias or a difference in recognition accuracy percentages between the 2 groups against CA. • However, the cognitive profile demonstrated that the children in the ASD group were not particularly high functioning and a sig. difference noted on SF stand. score on BFRT. RESULTS • Expected developmental pattern was a reduction in “threshold” level with age. • ALL participants demonstrated a significant increase in contour detection with increasing chronological age (CA), 3p=0.008. • Similar overall contour detection rates were noted in both groups (4p=0.743). • However, participants with ASD did not demonstrate a “typical” developmental trajectory as they showed increasing divergence from normal trajectory with CA (5p=0.016). OVERALL CONCLUSIONS • Visuo-spatial skills increase with CA, regardless of whether the individual is TD or • has an ASD. • Only low-level perception in autism demonstrated a non-typical developmental pattern with CA. References For R2 rating: white writing = TD; black writing = ASD. Each beside appropriate trajectory line. • Frith, U. (2003). Autism: Explaining the Enigma. (2nd ed.) Oxford: Blackwell. • Jolliffe, T. & Baron-Cohen, S. (1997). Journal of Child Psychology and Psychiatry, 38, 527 – 534. • Kovács, I. (2000). Vision Research, 40, 1301 – 1310. • Mottron, L. & Belleville, S. (1993). Brain and Cognition, 23, 279 - 309. • Sasson, N. J. & Reznick, J. S. (2005). Biennial Meeting of The S.R.C.D. Atlanta, USA. • Shah, A. & Frith, U. (1993). Journal of Child Psychiatry and Psychology, 34, 1351 – 1364. • Tanaka, J. W., Kiefer, M. & Bukach, C. M. (2004). Cognition, 93, B1 - B9. • Wing, L. & Gould, J. (1979). Journal of Autism and Developmental Disorders, 9, 11 – 29. • Wing, L. & Potter, D. (2002). Mental Retardation and Developmental Disabilities, 8, 151 – 161. 3F(1,34) = 8.02, p=0.008 4F(1,34) = 0.110, p=0.743 5F(1,34) = 6.43, p=0.016 CONCLUSION • All participants demonstrated an increased in contour-detection ability with CA, • regardless of participant grouping. • There was no significant difference in the overall contour detection ability between the • participant groups. • However, children with ASD demonstrated an increasing divergence from the expected • developmental trajectory with CA. This suggest that the relationship between contour- • detection and CA is different in ASD when compared to TD. With special thanks to Elisabeth Cook and ABC after school club, Ruislip Gardens School, Hillingdon. Hillingdon Manor Lower and Middle School, Hillingdon, Margaret Thomson, Rachael Gabriel and all the children who participated. 1Contact Details:elizabeth.thomson@brunel.ac.uk This research was conducted in partial fulfillment for the award of M.Sc Cognitive Neuropsychology. UCL, University of London, UK.