Download
1 / 27
480 likes | 2.28k Vues
Heavy-Duty Diesel Engine Cooling Systems. Tom McKinley Cummins, Inc. Objectives. Provide background information useful to tomorrow’s lab project (Evaluation of a Water Cooled Exhaust Manifold). Topics covered: Typical heavy-duty (HD) diesel engine designs

E N D
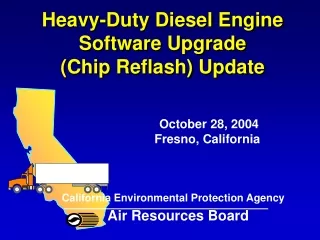
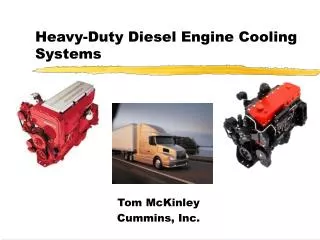
Heavy-Duty Diesel Engine Cooling Systems Tom McKinley Cummins, Inc.
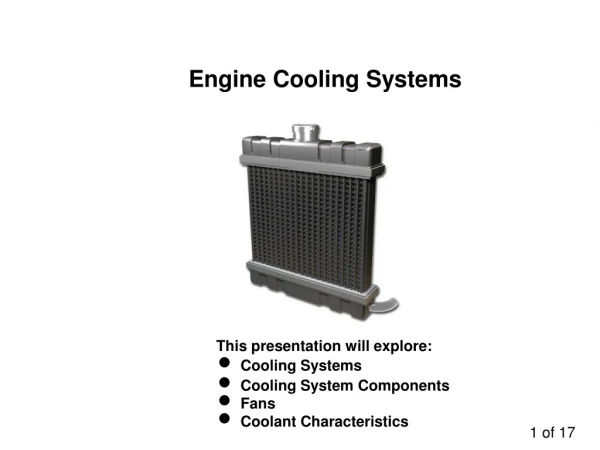
Objectives • Provide background information useful to tomorrow’s lab project (Evaluation of a Water Cooled Exhaust Manifold). Topics covered: • Typical heavy-duty (HD) diesel engine designs • Common HD automotive diesel applications • Introduction to engine cooling systems • Arrangement • Development Tools • Design Constraints
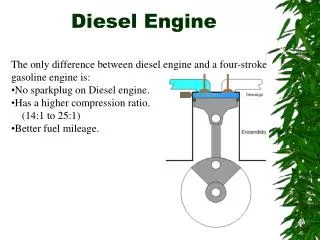
Typical HD Diesel Engine Design • 10 to 15 liters displacement • Inline-six • Turbocharged • Air-to-Air Aftercooling • 300-600 hp at 1600-2100 rpm • 1250-2000 lb-ft Max Torque at 1200 rpm • Dry weight 2000-2800 lb • Reliability/Durability • 250,000 mile/2 year base warranty • 500,000 mile/5 year extended warranty • 1,000,000 mile life expectation
Typical HD Diesel Engine Application • 80,0000 lb GVW • 100,000 to 150,000 miles per year • 6 MPG • Operating range from sea level to >8,000 ft altitude • Ambient temperatures from below zero to 115 deg F
Typical HD Diesel Engine Duty Cycle • Average load of 180-200 hp • Most of fuel used at “cruise” rpm of 1400-1700 rpm • Varying load at cruise due to operation of cruise control • Varying engine speed due to road speed changes in traffic or urban operation
Thermo-Fluid Systems on HD Diesel Engines • Cooling System • Air Handling System • Lube System • Fuel System
Engine Cooling System Layout Qmnf Qrad Qhead + Qblock Qoil Wpump
Functions of the Cooling System • To prevent excessively high and low engine component temperatures • To provide a heat sink for the lube system • To reject engine heat to the ambient • To provide a heat source for the truck cab • To provide a coolant source for other OEM equipment (e.g. torque converter coolers, fuel heaters) The optimal cooling system meets system requirements while minimizing life cycle cost (initial cost, warranty/reliability, operating/fuel cost). Tomorrow’s lab will give you the opportunity to evaluate designs from a life cycle cost perspective.
Water Pump Oil Cooler Liners Heads Water Manifold/Water Header Thermostat Bypass Radiator Charge Air Cooler Freon Condenser Radiator Fan Fan Drive (Drive Ratio, Fan Clutch) Fan Shroud Air Dams Cab Heater Auxiliary Coolers Design Control Responsibilities Engine Manufacturer Truck Manufacturer
Cooling System Development Techniques • Water Pump Performance Testing • Engine Flow Stand • Flow Bench • Flow Circuit Simulation • CFD Analysis • FE Analysis • Thermal Mapping Test • Oil Cooler Performance Testing • Chassis Dyno
Water Pump Performance Test • Used to determine: • Pump capacity (flow rate) as a function of pressure rise and pump speed • Pump efficiency and parasitic power • NPSH and cavitation temperature
Water Pump Cavitation • What is It? • The formation of vapor at the pump inlet due to local pressures dropping below the saturation pressure. • When does it Occur? • High coolant temperatures (high saturation pressure) • High coolant flow rate (low local static pressure) • Why is it Important? • Leads to a reduction of pump flow rate, therefore lower radiator effectiveness, therefore higher coolant temps, therefore more cavitation (runaway coolant temperatures) • Leads to an increase in water pump seal temperature (fails the seal) • Theoretically can lead to erosion of the impeller but generally the failure modes listed above occur first.
Engine Flow Stand • Used to determine: • Radiator flow rate vs radiator restriction • Coolant pressure distribution within engine • Coolant flow rate through external components • Allows estimation of coolant flow distribution within engine using flow circuit modeling
Engine Restriction Curve Overlayon Pump Map • DP is proportional to the square of the flow rate (energy equation -> DP is proportional to V squared) • Pump head rise is proportional to the square of the pump speed • Flow rate is linear with engine speed
Flow Bench • Used to determine: • Component coolant flow vs pressure drop relationship (“hydraulic resistance”) • On-engine component coolant flow rates and parasitic power using flow circuit simulation or flow stand testing
Hydraulic Resistance:Analogy to Electrical Circuits “Geometric” Elements “Resistive” Elements Both equations are of the form: Note that voltage (v) is analogous to pressure drop, and current (i) is analogous to volumetric flow rate. Hydraulic resistance is a function of the flow rate. Because of this non-linearity, iteration is needed to obtain hydraulic circuit solutions.
Flow Circuit Simulation • Based on the analogy of hydraulic and electrical circuits • Used to determine: • Cooling system parasitic power by component and for the entire system • Coolant flow distribution within the engine • Approximate coolant velocity • Assists the design effort by allowing the design to be iterated quickly before hardware is procured.
CFD Analysis • Used to determine • Coolant pressure drop for use in flow circuit modeling • Velocity distribution • Coolant side boundary conditions (temperature and heat transfer coefficient) for thermal FE analysis • Model predictions are validated by thermal mapping, flow bench testing, and flow visualization.
FE Analysis • Used to determine • Component temperatures • Component stresses • Fatigue life • Model calibrated to thermal mapping engine measurements
Thermal Mapping Test • Used to calibrate thermal FE models
Oil Cooler Performance Test • Used to determine: • Oil cooler heat transfer rate as a function of oil flow, coolant flow, and fluid temperatures • Oil cooler coolant and oil side restriction • On-engine oil cooler coolant flow rates and parasitic power using flow circuit simulation or on-engine testing
Truck Cooling Package Layout Note: Tomorrow’s lab includes optimization of a truck cooling package
Chassis Dyno Facility • Used to determine coolant temperatures and engine heat rejection under simulated hot ambient conditions • Capable of handling the largest HD trucks and engines • 5 foot by 7 foot air tunnel can provide up to 35 MPH ram air into radiator • Mixing ambient air with recirculated air allows the air temperature into the radiator to be varied to limiting ambient conditions (100-115 deg F)
Vertical Exhaust Louver OUTSIDE ROOF GARAGE DOOR Cover Grates Diffuser exit External Vertical Louvers Internal Horizontal Louvers Dyno Rollers Blower Air Flow Chassis Dyno Schematic
Summary • Cooling system design requires the optimization of components and the system as whole to meet competing objectives of: • Initial Cost • Warranty/reliability • Operating/fuel cost • Cooling system components are under the design control of both the engine and truck manufacturer. Cooperation is needed to deliver the best product to the end user.