Question 1 (40 points)
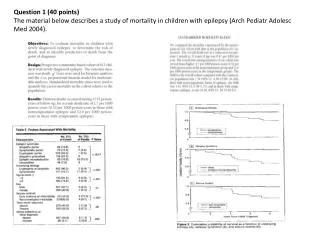
Question 1 (40 points) The material below describes a study of mortality in children with epilepsy (Arch Pediatr Adolesc Med 2004). a) Table 2 presents factors associated with mortality. Consider the data on seizure control.

Question 1 (40 points)
E N D
Presentation Transcript
Question 1 (40 points) The material below describes a study of mortality in children with epilepsy (Arch PediatrAdolesc Med 2004).
a) Table 2 presents factors associated with mortality. • Consider the data on seizure control. • Estimate the relative risk for the association between early evidence of intractability and death. • Estimate the odds ratio. • Estimate, in this cohort, the etiologic fraction (synonyms: etiologic fraction in the population; population attributable risk percent).
b) On the basis of Table 2 data, would you consider age as a potential confounder for the association between seizure control and death? Justify your answer. (2-3 sentences)
c) Suppose that the following data on age and seizure control among study subjects have been provided to you by the authors (fictitious data): • Age < 2 years: 130 subjects • Early evidence of intractability: 30 • Not immediately intractable: 100 • Age ≥ 2 years: 483 subjects • Early evidence of intractability: 30 • Not immediately intractable: 453 (includes 9 subjects with missing data) • How would these data influence your judgment regarding age as a potential confounding variable for the association between seizure control and death? • Justify your answer.
d) Figure 2 presents survival analyses. What type of measure of disease frequency is estimated in such analyses: prevalence, risk, incidence rate, other? Explain. (1 sentence)
e) The authors did not provide any measure of the precision of the mortality estimate in their cohort. • Define the word precision in that context. (1 sentence) • Give one example of a statistical measure of the precision of mortality estimates.
f) Indirect standardization was used to compare mortality in the study cohort to mortality in Connecticut. • What type of bias is addressed by standardization? • (1 sentence) • Standardization involves the use of a population distribution over one or more covariates as standard weight. In this study, what population represented the source of the standard weights? (1 sentence)
g) Table 3 (below) indicates that the median follow-up in this cohort (the Connecticut cohort) was 7.9 years. On the basis of Table 3 data, estimate the average duration of follow-up. Give one advantage of presenting, in cohort studies, the median duration of follow-up, as opposed to the average.
Question 2 (30 points) The material below describes a study of mammography and breast cancer mortality (Am J Public Health 1998). OBJECTIVES: The purpose of this study was to determine the relationof screening mammography to breast cancer incidence and casefatality. METHODS: In a sample of White female Medicare beneficiarieshospitalized in 1990-1991, age-adjusted breast cancer incidenceand 2-year case fatality rates were estimated and compared withthe frequency of mammographic screening from a population-basedsurvey. To determine mammography use in each state, we used interview data from the Behavioral Risk Factor Surveillance System (BRFSS), a multistage probability sample of adults administered by the Centers for Disease Control and Prevention. The sample for this study was restricted to White female respondents 65 years old and older. The BRFSS obtains information on past use of mammography as well as interval since last mammogram. Because respondents may not be able to accurately recall the date of their last mammogram, we considered a report within 5 years as an indication of use and included only mammograms performed for screening.
a) The populations of 29 American states were used for this study. Did these population represent fixed (closed) cohorts, or did they represent dynamic populations? Explain. (1-2 sentences)
b) Table 1 shows mammography rates for the 29 states. Do these mammography rate represent prevalence or incidence figures? • Explain. (1-2 sentences)
c) Kleinbaum et al. (course textbook) indicate that “An ecologic study is an incomplete design…” (page 59). Using the mammography study as an example, explain what is meant by “incomplete design.” (1-2 sentences)
d) Using the mammography study as an example, describe one circumstance in which ecologic studies may be affected by the ecological fallacy.
Question 3 (30 points) The material below describes a study of alcohol and orofacial clefts (Am J Epidemiol 2007). Using data from the National Birth Defects Prevention Study, the authors investigated the association between maternal reports of periconceptional alcohol consumption and clefting. Cases with a cleft lip, cleft palate, or both and unaffected controls delivered from 1997 through 2002 were ascertained. Interview reports of alcohol consumption were obtained from 1,749 (75.1%) case and 4,094 (68.2%) control mothers. Adjusted odds ratios and 95% confidence intervals were calculated to assess associations. Compared with odds ratios for mothers with no reported consumption, those for mothers who consumed alcohol tended to be near to (cleft lip, cleft lip with cleft palate) or to exceed (cleft palate) unity. The odds ratios associated with binge drinking were elevated but did not demonstrate significantly increased risk for any phenotype; however, the odds ratios differed by the type of alcohol consumed, particularly for cleft palate (distilled spirits > wine > beer). These odds ratios were further increased among mothers with no reported folic acid intake.
In the abstract, the authors indicate that alcohol consumption data were obtained from 75.1 % of the cases and 68.2% of the controls. Under what circumstances would such response rates lead to selection bias (selection bias understood in its strict sense, i.e., not correctable by a stratified analysis)?
The cases and the controls were all delivered from 1997 through 2002, in the United States. Would this feature of the study lead to problems in generalization of the results to Canadian babies born in 2007? Explain. (3-5 sentences)
c) On the basis of Table 5 data, considering cleft palate only, assess the presence of additive interaction between distilled spirits and folic acid intake. Restrict your analysis to the comparison of distilled spirits versus no alcohol.
Question 1 (35 points) The material below describes a meta-analysis on statin therapy (CMAJ 2008).
a) Table 2 indicates that several of the reviewed studies were double-blind trials. Describe the type of bias (confounding, information, selection bias) addressed by blinding in experimental studies. (3-5 sentences)
b) Table 4 gives data on rhabdomyolysis. Under what circumstances would errors in the diagnosis of rhabdomyolysisnot be associated with a bias in the odds ratio estimates shown in the table? (2-3 sentences)
c) The authors of these studies observed that the average age at diagnosis of rhabdomyolysis in white males was lower than in non-white males (data not shown). What may be the significance of this observation with respect to the epidemiology of rhabdomyolysis? (2-3 sentences)
d) Table 2 describes the quality assessment of the reviewed studies, including the Jadad score. Would you consider the Jadad score as a nominal, ordinal, interval, or ratio scale? Justify your answer. (2-3 sentences)
e) One advantage of meta-analyses is the large sample sizes generally available to the authors. In meta-analyses of clinical trials, what types of errors are affected by the large sample sizes? (1-2 sentences)
f) Table 4 gives data on myalgia in the reported trials (myalgia: pain in a muscle or muscles). Would the case-crossover design represent a good option to investigate the association between statin use and myalgia? Justify your answer. (5-8 sentences)
Question 2 (35 points) The material below describes a study of mammography screening (BMJ 2005).
a) The abstract gives effect estimates for the screening program. • Do these results suggest that screening mammography produces lead time in the diagnosis of breast cancer? Explain. (2-3 sentences) • Can these results be affected by length-biased sampling? Explain. (2-3 sentences)
b) The abstract indicates that the participants were defined as all women ever invited to mammography screening in the first 10 years of the program. In practice, fewer than 71% of the invited women actually participated in the program. • Give one advantage of defining participants as invited women as opposed to actually screened women. • Give one disadvantage.
c) Would it be possible to estimate case-fatality rates from the data provided in Table 2? Why or why not?
d) Rothman identifies prognostic selection bias as a possible bias affecting screening studies. List three methods that may be used to handle this type of bias in the design or analysis of studies of screening efficacy. (1 sentence for each method)
e) Consider Table 2 data for women 50-54 years of age. The number of breast cancer deaths observed in the study group was 9. Calculate the expected number of breast cancer deaths, using data from the national control group.
Question 3 (30 points) The material below describes a study of health and intimate partner violence (MMWR 2008). Intimate partner violence (IPV) is defined as threatened, attempted, or completed physical or sexual violence or emotional abuse by a current or former intimate partner. IPV can be committed by a spouse, an ex-spouse, a current or former boyfriend or girlfriend, or a dating partner (1). Each year, IPV results in an estimated 1,200 deaths and 2 million injuries among women and nearly 600,000 injuries among men (1). In addition to the risk for death and injury, IPV has been associated with certain adverse health conditions and health risk behaviors (1). To gather additional information regarding the prevalence of IPV and to assess the association between IPV and selected adverse health conditions and health risk behaviors, CDC included IPV-related questions in an optional module of the 2005 Behavioral Risk Factor Surveillance System (BRFSS) survey. This report describes the results of that survey, which indicated that persons who report having experienced IPV during their lifetimes also are more likely to report current adverse health conditions and health risk behaviors. Although a causal link between IPV and adverse health conditions cannot be inferred from these results, they underscore the need for IPV assessment in health-care settings. In addition, the results indicate a need for secondary intervention strategies to address the health-related needs of IPV victims and reduce their risk for subsequent adverse health conditions and health risk behaviors.
a) Using data from Table 2 on arthritis in women, estimate: • the odds of arthritis in the IPV group • the prevalence of arthritis in the entire group of women (IPV plus No IPV) • the odds ratio, comparing IPV to No IPV
b) Table 3 presents prevalence odds ratios. Consider the prevalence odds ratio for the association between disability (current use of disability equipment) and intimate partner violence, in women. Under what circumstances would the prevalence odds ratio represent a valid estimate of the incidence rate ratio? (5-8 sentences)
c) Intimate partner violence (IPV) was determined through a questionnaire administered in 2005. • If you wanted to determine the reliability of the assessment of IPV, comparing the responses of study subjects to the same questionnaire two weeks apart (each time with the same subjects), what statistical measure would you propose to use? (1 sentence) • Assume that you found that the IPV assessment was highly reliable, what could you infer about the validity of the assessment?
d) Consider the questions concerning intimate partner violence. Suppose that you would like to develop a French version for use in Quebec. • Describe the usual method used to ascertain the cross-language equivalence of such questionnaires. (2-3 sentences) • In a reliability study of the French questionnaire, you observe that reliability is less than for the English version. Give two broad explanations for these differences in reliability between the English and the French questionnaires. (2-3 sentences) • What is the purpose of back-translation in producing a French questionnaire from an English version? (2-3 sentences)