Download
1 / 18
190 likes | 326 Vues
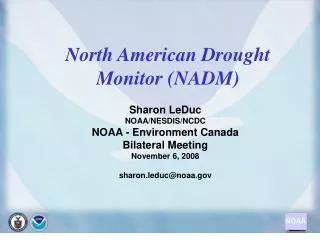
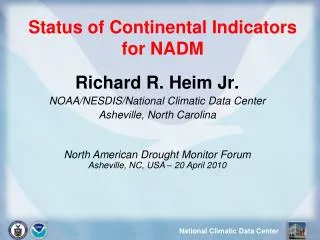
Status of Continental Indicators for NADM. Richard R. Heim Jr. NOAA/NESDIS/National Climatic Data Center Asheville, North Carolina North American Drought Monitor Forum Asheville, NC, USA – 20 April 2010. NADM History. November 2001 – “Troika” Meeting (US, CN, MX)

E N D
Status of Continental Indicatorsfor NADM Richard R. Heim Jr. NOAA/NESDIS/National Climatic Data Center Asheville, North Carolina North American Drought Monitor Forum Asheville, NC, USA – 20 April 2010
NADM History • November 2001 – “Troika” Meeting (US, CN, MX) • Agree in principle to establish climate extremes monitoring partnership (*) • First, develop monthly continental drought monitoring capabilities • Eventually assess long-term variability and trends in extremes (**) • April 2002 Workshop – Plans for NADM • One day devoted to discussion on the new drought monitoring program for North America • April 2003 – First experimental NADM map released to public • November 2003 – Addition of French and Spanish translations of map (** National Climate Preparedness & Potential IPCC Applications) (* NACEM)
NADM Participant Responsibilities • Responsibilities & Procedure • Each country determines drought depiction & narrative within their national boundaries • NADM lead authorship rotates amongst the participants • US: NOAA (NCDC, CPC), USDA (JAWF), NDMC • Canada : AAFC, MSC • Mexico: SMN • NADM lead author integrates national drought assessments from each country, prepares continental monthly map & narrative • Continental indicators used for international boundaries • All participants peer review product http://www.ncdc.noaa.gov/oa/climate/monitoring/drought/nadm/index.html
NADM Continental Drought Indicators • The NADM drought conditions in US, MX, CN are determined independently based on different data, indices, & analyses within each country • Drought indices covering entire continent are needed • Same indices, same analysis period, same methodologies • This consistency needed for depiction across international boundaries http://www.ncdc.noaa.gov/oa/climate/monitoring/drought/nadm/index.html
NADM Continental Drought Indicators • NADM Drought Indicators data base: • Mexico: • Monthly precipitation from 132 highest quality stations • Temperature from 65 high quality Observatory stations, plus 67 add’l stations • Canada: Monthly precipitation and temperature from approx. 200-300 daily near-real time stations (DLY02) • U.S. • First set: • 20-24 Alaska ASOS stations & 8 COOP stations along US-MX border • Climate division data for contiguous U.S. • Second set: • 20-24 Alaska ASOS stations & 900-1000 contiguous U.S. COOP stations • Future: Climate Divisions for all 3 countries http://www.ncdc.noaa.gov/oa/climate/monitoring/drought/nadm/index.html
Two Contiguous U.S. Data Sets Climate Divisions Stations
NADM Continental Drought Indicators • For Percent of Average Precipitation (PCTPCP), Standardized Precipitation Index (SPI), & Palmer Drought Indices (PDI): • Period of record varies between countries and between stations within each country • Except p.o.r. is 1895-present for U.S. climate divisions • For the stations, p.o.r. generally begins in 1950 or earlier • Standardizing period is 1951-2001
NADM Continental Drought Indicators • Other indicators from other sources are also used • NOAA/NESDIS Satellite Vegetation Health Index • NOAA/CPC Leaky Bucket Soil Moisture Percentiles
NADM Continental Drought Indicators • Other indicators that could be used • University College London’s Global Drought Monitor
Living Blended Paleo Drought Project • This project is intended to expand our historical perspective • Serially and spatially complete • But it will have an operational component that can be used to support the NADM • Station data network across U.S., Canada, & Mexico • 0.5 x 0.5 degree latitude/longitude grid, 11,398 gridpoints • Fine spatial resolution for continental monitoring • Will be updated operationally on a monthly basis 11,398
LBPD NADM Operational Support • The LBPD gridded data base can support: • NADM continental indicators (SPI, Palmer Indices, PCTPCP) • NADM Objective Blends • FMDI for North America
Precipitation Climatologies for N. America • Percent of annual precipitation maps • Monthly, 3-Month Seasons, 6-Month Seasons
USDM & NADM Objective Blends • Objective blends integrate multiple indicators into a product update using a percentile ranking method • All parameters are first rendered as percentiles with respect to a standard period using a percent rank method • The parameters (drought indicators) are then combined using a weighting scheme • Short- and Long-Term Blends produced • Need serially complete data • Operationally produced weekly for USDM using NOAA/CPC’s real-time daily and weekly climate division data and NOAA/NCDC’s monthly archive of indices for 1932-2000 • Experimental for NADM; monthly; use gridded temperature, precipitation, & Palmer index fields for North America; 1895-2005
NADM Objective Blends USDM Objective Blends: • Similar to USDM Objective Blends, but with different components and possibly different weights • Would need serially complete data, so could not be computed on station data • But could be computed on LBPD Project’s gridded data base
NADM Objective Blends • NADM percentiles based on 1895-2005 • 0.5x0.5-degree gridded data base • Short-term blend components: • Palmer Z Index (35%) • 3-month precipitation (30%) • 1-month precipitation (25%) • Palmer Drought Index (10%) • Long-term blend components: • Palmer Hydrological Drought Index (30%) • 60-month Palmer Z Index (20%) • 60-month precipitation (20%) • 24-month precipitation (10%) • 12-month precipitation (10%) • 6-month precipitation (10%)
NADM – Web Services • NADM web site – transitioning to interactive web site with GIS web services (within NIDIS Drought Portal environment) • NADM indicators – overlay and analysis with NADM map boundaries using various visualization tools • NADM indicator station, divisional, and gridded (from LBPD) data in relational data base for efficient access & analysis & interoperability between various projects & applications
Thank You! Richard.Heim@noaa.gov NCDC Climate Monitoring Branch Reports & Products: http://www.ncdc.noaa.gov/oa/climate/research/monitoring.html NCDC State of the Climate Reports: http://www.ncdc.noaa.gov/sotc/ North America Drought Monitor: http://www.ncdc.noaa.gov/oa/climate/monitoring/drought/nadm/index.html U.S. Drought Monitor: http://drought.unl.edu/dm/monitor.html NIDIS: http://drought.gov/