Download
1 / 12
120 likes | 235 Vues
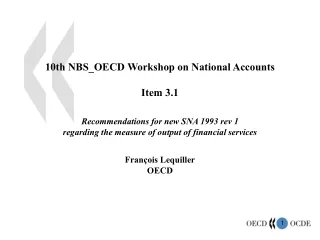
UK Centre for the Measurement of Government Activity. Measurement of non-market output in Education. Mariagrazia Luciano OECD conference 3-5 October 2006. Summary. Background notes: old and new methodology Measurement of Education Output Education Productivity articles

E N D
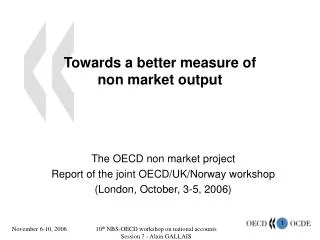
UK Centre for the Measurement of Government Activity Measurement of non-market output in Education Mariagrazia Luciano OECD conference 3-5 October 2006
Summary • Background notes: old and new methodology • Measurement of Education Output • Education Productivity articles • New measures of Education Output: adjusting for quality and real earning growth • Supporting evidence: triangulation • Next steps
Backgroundnotes: old and new methodology • Previous NA method: Education output = Education inputs • In 1998 introduced direct volume measure: pupil numbers and Quality Adjustment (QA) of 0.25% based on GCSE exam results - England used as a proxy for UK • Following Atkinson Review recommendations (chapter 9): • Attendance instead of number of students for schools (AR 9.1) • Health courses, ITT and nursery places included (ARs 9.4-9.7)
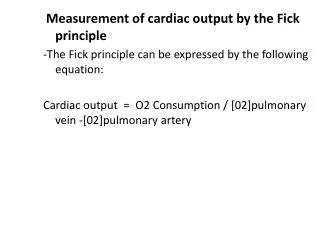
Measurement of Education Output fte: full-time equivalent pupil numbers
Education output 1995 - 2004 Currently in National Accounts Average change 1% per year 102 output measure 100 98 96 94 92 90 88 86 1995 1996 1997 1998 1999 2000 2001 2002 2003 2004 Years
Education productivity articles • 1st Education Productivity article published by UKCeMGA in October 2005 • output and productivity trends 1995-2004 comparing previous and new methodology • Presenting the possible methods for quality adjustments and related debate • Triangulation section: providing wider sources of information on the quality of Government Education services
New Education output measures • Adjusting for Quality of output Pupil attainment • GCSE threshold 5+ A* to C • GCSE Average Point Score Key Stage Progress • Progress between Key Stage Tests – at age 7,11,14,16 • Adjusted Key Stage – apply results to all years age 5-16 • Adjusting for Real Earning Growth
New Education output measures with quality adjustment 110 National Accounts BB05 GCSE threshold 105 Adjusted KS progress 100 95 90 85 80 1998 1999 2000 2001 2002 2003 2004
New Education output measures with earnings growth BB05 output GCSE threshold Adjusted KS progress New earnings adjustment 1.5% per year
Supporting evidence - Triangulation • Ofsted results – improved teaching standards • Class size • reduction • increased classroom support • Public assessment – improved standards • PSA targets – progress towards targets
Next steps • Undertake a wider consultation program to gain expert views on how to develop an appropriate method for output Quality Adjustment and Real Earnings Growth • Improving output and inputs estimates • Improving triangulation methods
Contact ukcemga@ons.gsi.gov.uk Mariagrazia.luciano@ons.gsi.gov.uk