Download
1 / 28
320 likes | 1.29k Vues
Measurement of cardiac output by the Fick principle ‑The Fick principle can be expressed by the following equation: Cardiac output = O2 Consumption / [02]pulmonary vein ‑[02]pulmonary artery. ‑The equation can be solved as follows:

E N D
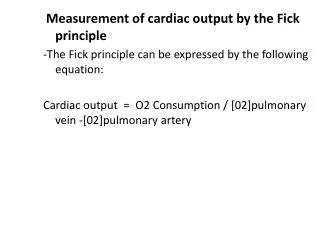
Measurement of cardiac output by the Fick principle ‑The Fick principle can be expressed by the following equation: Cardiac output = O2 Consumption / [02]pulmonary vein ‑[02]pulmonary artery
‑The equation can be solved as follows: 1. Oxygen consumption for the whole body can be measured. 2. Pulmonary vein [02] can be measured in a peripheral artery. 3. Pulmonary artery [02] can be measured in mixed systemic venous blood. ‑For example, a man has a resting O2 consumption of 250 ml/min, a peripheral arterial O2 content of 0.20 ml O2/ml of blood, and a mixed venous O2 content of 0.15 ml O2/ml of blood. What is his cardiac output?
Cardiac output = 250 ml/min / (0.20 ml O2/ml‑ 0.15 ml O2/ml) = 5000 ml/min or 5.0 L/min (typical value for a 70‑kg male)
Definitions • Preload • amount of stretch on the ventricular myocardium prior to contraction • Afterload • the arterial pressure (or some other measure of the force) that a ventricle must overcome while it contracts during ejection • Impedance/resistance to ventricular ejection • Contractility • myocardium’s intrinsic ability to efficiently contract and empty the ventricle • (independent of preload & afterload)
Determinants of Cardiac Output (CO) Preload Contractility Stroke Volume Afterload Heart Rate Cardiac Output
Contractility. This is a change in contractile energy of the heart that is not due to changes in fibre length, but rather to external factors such as SNS activity or drugs. -is also called inotropism. ‑can be estimated by the ejection fraction (stroke volume / end-diastolic volume), which is normally 0.55 (55%). ‑Agents that produce an increase in contractility have a positive inotropic effect. ‑Agents that produce a decrease in contractility have a negative inotropic effect.
Factors that increase contractility (positive inotropic effects) a. Increased heart rate ‑more action potentials per unit time ->Ca2 + entry into the myocardial cell-> Ca2 + released from the SR-> greater tension produced during contraction. b. Sympathetic stimulation (catecholamines) via beta1 receptors c. Cardiac glycosides (digitalis) ‑increase the strength of contraction by inhibiting Na+,K+ ATPase in the cardiac muscle cell membrane
Factors that decrease contractility (negative inotropic effects) ‑Parasympathetic stimulation (ACh) via muscarinic receptors decreases the strength of contraction in atria by decreasing Ca2+ entry into the cell during the plateau of the cardiac action potential (inward Ca2+ current).
Changes in contractility shift the Frank-Starling curve upward (increased contractility) or downward (decreased contractility). a. Increases in contractility cause an increase in cardiac output for any level of venous pressure, right atrial pressure, or end-diastolic volume. b. Decreases in contractility cause a decrease in cardiac output for any level of venous pressure, right atrial pressure, or end-diastolic volume.
Afterload Increase in afterload decreases SV. • High blood pressure: decreases SV • Cholesterol: decreases SV(increases afterload) • Obesity : decreases SV(increases afterload) • Stress: decreases SV • Exercise: increases SV
Afterload and Cardiac Performance • Afterload: all the factors that impede fiber shortening, in this case it would be all the factors that impede the ejection of blood from the ventricle. What the heart has to pump against • Volume of blood in the arterial circulation • Pressure in aorta at onset of ejection (DAP) • Compliance of aorta • Size of outflow orifice
The Diastolic Arterial Pressure (DAP) is the major component that governs afterload in the normal individual because it is the only factor subject to moment to moment changes.
Conditions that Increase Afterload • Hypertension • Aortic stenosis • Increased Hr • In chronic pathological conditions these can lead to chronic pressure overload of the heart
Myocardial Hypertrophy • Cross sectional area of a muscle increases when repeatedly exposed to an elevated work load over a sustained period of time • In cardiac muscle this can be the result of increased wall tension caused by increased preload, increased afterload or increased heart rate. • Some hormones have also been implicated in the process • Norepi, angiotensin II, and thyroxin physiology
Three Types of Hypertrophy 1) Physiological – occurs in athletes in response to long term endurance exercise. there is a symmetrical enlargement 2) Concentric – occurs as a result of long standing pressure overload. Thickness ratio is increased, ventricle lumen size can be unchanged or reduced. 3) Eccentric – occurs as a result of long standing volume overload. Hypertrophies away from lumen, enlarging lumen size and the thickness ratio is reduced. physiology
Swollen legs A 47 year old woman was brought to the hospital because of severe shortness of breath and swelling of her lower body. Over the last year *she had noticed periods of shortness of breath while doing her housework (exertionaldyspnea). She also had shortness of breath while lying down (orthopnea). The patient often awoke at night with a sensation of not getting enough air and she had to sit or stand to obtain relief (paroxysmal nocturnal dyspnea). #More recently she noticed swelling first of her lower extremities and then of her lower abdomen. The swelling was worse through the day and decreased overnight. She reported awakening three to four times a night to urinate. The patient did not remember any ill health before these problems began. Physical examination revealed a woman sitting up in bed in mild to moderate respiratory distress. Her blood pressure was 100/70, pulse was 120 and weak. Respirations were 26 per minute and labored. There was jugular venous distension, even while she was sitting. Palpation of the sternum revealed a restrosternal lift. Auscultation of the heart revealed an opening snap and a long diastolic rumble at the apex. Auscultation of the lungs revealed crackles halfway up the lungs. There was also severe lower extremity edema. During her hospitalization, as part the work-up, the following studies were done. • Use the data in the table above to calculate cardiac output and ejection fraction · Evaluate the mean electrical axis of the heart using the ECG shown overleaf
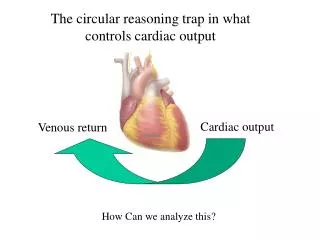
C. Regulation of CO and Venous Return (VR) “ VR determines CO”, but since VR is not an independent variable, and is largely determined by Central Venous Pressure (CVP), so it is more accurate to say that CVP determines CO • CVP is affected by blood volume (BV), vasoconstriction and arteriolar vasoconstriction . When VR becomes higher than the heart can pump (e.g. exercise), then the contractility of the heart is adjusted () by SNS, so that CO is matched to the VR
Quantitative Analysis of CO Regulation Two primary factors are related to CO regulation: 1. The pumping ability of the heart (represented by CO curves that we discussed); and 2. The factors that affect CVP, and consequently VR. These are represented by the vascular function curves (also known as the venous return curves) Vascular Function Curves: - VR is determined by P between central veins and the right atrium. The grater P the larger VR and vice versa - The lower the pressure in RA, the greater the pressure gradient between the veins and RA, and vice versa (as RAP, VR )
Mean Systemic Filling Pressure (MSFP) • The graph shows that as RAP, VR. The slope is very steep, and this is due to the fact that veins are very compliant (distensible) • When RAP is ~7 mm Hg, the VR is zero, i.e. there is no pressure gradient between RA and the veins to drive the blood back to the heart. This pressure is referred to as mean systemic filling pressure • The value of MSFP is 7 mm Hg and not zero because it depends on the volume of blood in the vascular system and its overall distensibility • The overall distensibility or compliance of vascular system depends on the degree of venomotor tone as well as artriolar tone • The factors affectingg MSFP are: Blood volume, Venomotor tone, Arteriolar resistance