Energy Balance and Body Composition
820 likes | 1.1k Vues
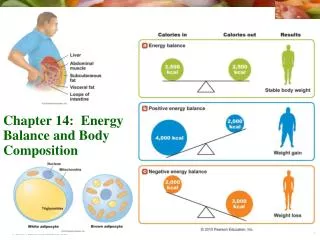
Energy Balance and Body Composition. Chapter 8. ENERGY. IN. OUT. Energy Balance. Excess energy is stored as fat Stored fat used for energy between meals Energy balance: energy in = energy out A shift in balance causes weight changes fat changes body composition changes- LBM, H 2 O

Energy Balance and Body Composition
E N D
Presentation Transcript
Energy Balance and Body Composition Chapter 8
ENERGY IN OUT
Energy Balance • Excess energy is stored as fat • Stored fat used for energy between meals • Energy balance: energy in = energy out • A shift in balance causes weight changes • fat changes • body composition changes- LBM, H2O • 1 pound of fat = 3500 kcalories • Health fat storage 50,000 - 200,000 kcal
Energy In: Food Composition • Direct measure of food’s energy value • Bomb calorimeter • Indirect measure of energy released • Oxygen consumed • Heat released • kCalorie calculations from grams prot, CHO, fat, EtOH
Insulated container keeps heat from escaping Thermometer measures temperature changes Motorized stirrer Reaction chamber (bomb) Food is burned Heating element Water in which temperature increase from burning food is measured
Energy In: Kcal Intake • Hunger: pain that causes food-seeking • Appetite: integrated response to nerve signals and chemical messengers • Hypothalamus • GI hormones, neuropeptide Y • Satiation – fullness, stops eating • Satiety – fullness that lasts til next meal • Influences that override physiological signals • positive (parties) and negative (grief)
1 Physiological influences • Empty stomach • Gastric contractions • Absence of nutrients in small intestine • GI hormones • Endorphins (the brain’s pleasure chemicals) are triggered by the smell, sight, or taste of foods, enhancing the desire for them 2 Sensory influences • Thought, sight, smell, sound, taste of food 5 Postabsorptive influences (after nutrients enter the blood) • Nutrients in the blood signal the brain (via nerves and hormones) about their availability, use, and storage • As nutrients dwindle satiety diminishes. • Hunger develops 1 Hunger Seek food and start meal 2 Satiety: Several hours later 5 Keep eating 3 Satiation: End meal 4 3 Cognitive influences • Presence of others, social stimulation • Perception of hunger, awareness of fullness • Favorite foods, foods with special meanings • Time of day • Abundance of available food 4 Postingestive influences (after food enters the digestive tract) • Food in stomach triggers stretch receptors • Nutrients in small intestine elicit hormones (for example, fat elicits cholecystokinin, which slows gastric emptying)
Energy In: Kcal Intake • Overriding hunger and satiety • Stress eating and comfort foods • External cues • time of day • availability • sight, smell of food • Environmental influences • Example: buffet, large portion size
Energy In: Kcal Intake • Sustaining satiation and satiety • Nutrient composition • Protein is most satiating • Low-energy density / High-fiber foods also more satiating • High-fat foods – stimulate appetite • low satiation • strong satiety from SI (cholecystokinin)
100 kcal 9 g fat 837 kcal 71 g fat 100 kcal 5 g fat 55 kcal 3 g fat For the same size portion, peanuts deliver more than 15 times the kcalories and 20 times the fat of popcorn. For the same number of kcalories, a person can have a few high-fat peanuts or almost 2 cups of high-fiber popcorn. (This comparison used oil-based popcorn; using air-popped popcorn would double the amount of popcorn in this example.)
837 kcal 71 g fat 55 kcal 3 g fat For the same size portion, peanuts deliver more than 15 times the kcalories and 20 times the fat of popcorn.
100 kcal 9 g fat 100 kcal 5 g fat For the same number of kcalories, a person can have a few high-fat peanuts or almost 2 cups of high-fiber popcorn. (This comparison used oil-based popcorn; using air-popped popcorn would double the amount of popcorn in this example.)
Energy In: Kcal Intake • The Hypothalamus • Control center for eating • Integrates messages from brain, GI, liver • Energy intake, expenditure, storage • Gastrointestinal hormones- see list in margin
Energy Out: Kcal expended • Thermogenesis- heat generated when kcal broken down • Total energy expenditure reflects 4 categories of thermogenesis • Basal metabolism • Physical activity • Food consumption • Adaptation
Components of Energy Expenditure Basal Metabolism • Uses about two-thirds of energy expended in a day • Metabolic activities • All basic processes of life • Basal metabolic rate (BMR) • Variations for sleep and awake • Weight • Lean tissue • Resting metabolic rate (RMR) not as precise
Components of Energy Expenditure – Physical Activity • Voluntary movement of skeletal muscles • Most variable component of energy expenditure • Amount of energy needed depends on • Muscle mass • Body weight • Activity • Frequency, intensity, and duration
Components of Energy Expenditure – Thermic Effect of Food • Use kcal to digest/absorb kcal • Acceleration of GI tract functioning in response to food presence • Requires energy, releases heat • CHO: 5-10%, Fat: 0-5%, Protein: 20-30% • Approximately 10 percent of energy intake • High-protein foods > high-fat foods • Regular meal > snacking
30-50% Physical activities 10% Thermic effect of food 50-65% Basal metabolism
Components of Energy Expenditure – Adaptive Thermogenesis • Adapt to dramatic change in temperature, trauma, exertion (extra work done by body) • Amount expended is extremely variable • Not included in energy requirement calculations
Estimating Energy Requirements • Gender • BMR and LBM • Growth • Groups with adjusted energy requirements • Age • LBM, hormones, activity level • Physical activity • PA Factor • Body composition & body size • Height • Weight • Height / weight • file:///E:/Media/Animations/chapter8/08ht1.html
Quick Calorie Ranges • To gain weight: 35-45 kcal/kg • To maintain weight: 25-35 kcal/kg • To lose weight: 15-25 kcal/kg
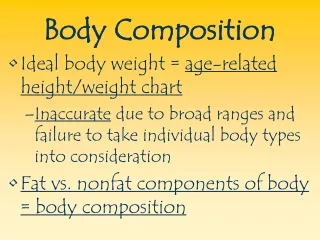
Body Weight, Composition, Health • Height/Weight indices unrelated to body composition • Both in use health for nutritional assessment • Subjective “body image” dictates behaviors • Ideal Body Weight (IBW) • Body Mass Index (BMI) • Useful for epidemiological studies
Body composition is healthy IBW / BMI says he is overweight
Defining Healthy Body Weight • Body mass index • Relative weight for height • BMI = weight (kg) height (m)2 • Health-related classifications • Healthy weight: BMI = 18.5 to 24.9 • Overweight: BMI = 25 to 29.9 • Obese: BMI = 30 to 39.9 • Morbidly Obese: BMI > 40
Table 1 Proposed range of ideal weights for women, ages 25 and over, Height (with shoes) Weight in pounds (as ordinarily dressed) Small frame Medium frame Large frame 5' 0" 105–13 112–20 119–29 5' 1" 107–15 114–22 121–31 5' 2" 110–18 117–25 124–35 5' 3" 113–21 120–28 127–38 5' 4" 116–25 124–32 131–42 5' 5" 119–28 127–35 133–45 5' 6" 123–32 130–40 138–50 5' 7" 126–36 134–44 142–54 5' 8" 129–39 137–47 145–58 5' 9" 133–43 141–51 149–62 5' 10" 136–47 145–55 152–66 5' 11" 139–50 148–58 155–69 6' 0" 141–53 151–63 160–74 Source: Metropolitan Life Insurance Company 1942
Centers for Disease Control • BMI is a fairly reliable indicator of body fatness for most people. BMI does not measure body fat directly, but research has shown that BMI correlates to direct measures of body fat, such as underwater weighing and dual energy x-ray absorptiometry (DXA).1, 2 BMI can be considered an alternative for direct measures of body fat. Additionally, BMI is an inexpensive and easy-to-perform method of screening for weight categories that may lead to health problems. • BMI is used as a screening tool to identify possible weight problems for adults. However, BMI is not a diagnostic tool. For example, a person may have a high BMI. However, to determine if excess weight is a health risk, a healthcare provider would need to perform further assessments. These assessments might include skinfold thickness measurements, evaluations of diet, physical activity, family history, and other appropriate health screenings.
Centers for Disease Control • Why does CDC use BMI to measure overweight and obesity? • Calculating BMI is one of the best methods for population assessment of overweight and obesity. Because calculation requires only height and weight, it is inexpensive and easy to use for clinicians and for the general public. • BMI inches and pounds formula: weight (lb) / [height (in)]2 x 703 Example: Weight = 150 lbs, Height = 5'5" (65")Calculation: [150 ÷ (65)2] x 703 = 24.96
Assessing Your Weight and Health Risk • BMI calculator file:///E:/Media/Animations/chapter8/08ht2.html • Assessment of weight and health risk involves using three key measures: • Body mass index (BMI) • Waist circumference • Risk factors for diseases and conditions associated with obesity
What 2 BMI ranges look like • http://www.flickr.com/photos/77367764@N00/1462394033/in/set-72157602199008819/ • http://www.flickr.com/photos/77367764@N00/1458201494/in/set-72157602199008819/
Clinical Ht/Wt Measures • IBW: Traditional ht/wt index Women: 100 lbs + 5 lbs/in > 5 ft (5”4” = 120 lbs) Men: 106 lbs + 6 lbs/in > 5 ft (6’2” = 190 lbs) • UBW: Usual Body Weight- average weight past 5-10 yrs. Useless reference point unless person has been in good health • ABW: Adjusted Body Weight- necessary for setting kcal needs with OW/obese persons. IBW + 1/3 excess wt = ABW
Body Weights in U.S. Adults Healthy weight (BMI 18.5 – 24.9) Underweight (BMI < 18.5) Overweight (BMI 25 – 29.9) Obesity (BMI 30 – 39.9) Extreme obesity (BMI ≥ 40)
Body Fat and Its Distribution • Important information for disease risk • How much of weight is fat? • Where is fat located? • Ideal amount of body fat depends on person • Normal wt man- 13-21% • Normal wt woman- 23-31% • Upper level for general disease risk • Young men- 22%; Men over 40- 25% • Young women- 32%; Women over 40- 35%
Body Fat and Its Distribution • Needing less body fat • Some athletes: 5-10% men, 15-20% women • Needing more body fat • Cold climate, pregnancy • Fat distribution affects health risk • Visceral fat / central obesity / apple-shaped • Subcutaneous fat / lower body fat / pear-shaped
In healthy-weight people, some fat is stored around the organs of the abdomen. In overweight people, excess abdominal fat increases the risks of diseases.
Upper-body fat is more common in men than in women and is closely associated with heart disease, stroke, diabetes, hypertension, and some types of cancer. Lower body fat is more common in women than in men and is not usually associated with chronic diseases.
Body Fat and Its Distribution • Waist circumference • Indicator of fat distribution & central obesity • Indicator of high risk for diabetes and CVD • Women: greater than 35 inches • Men: greater than 40 inches • Waist-to-hip ratio • Other techniques for body composition • More precise measures
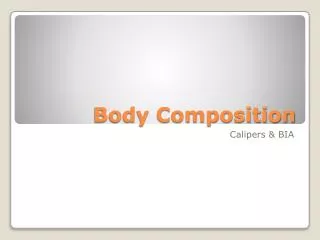
Skinfold measures estimate body fat by using a caliper to gauge the thickness of a fold of skin on the back of the arm (over the triceps), below the shoulder blade (subscapular), and in other places (including lower-body sites) and then comparing these measurements with standards.
Hydrodensitometry measures body density by weighing the person first on land and then again while submerged in water. The difference between the person’s actual weight and underwater weight provides a measure of the body’s volume. A mathematical equation using the two measurements (volume and actual weight) determines body density, from which the percentage of body fat can be estimated.
Bioelectrical impedance measures body fat by using a low-intensity electrical current. Because electrolyte-containing fluids, which readily conduct an electrical current, are found primarily in lean body tissues, the leaner the person, the less resistance to the current. The measurement of electrical resistance is then used in a mathematical equation to estimate the percentage of body fat.
Air displacement plethysmography estimates body composition by having a person sit inside a chamber while computerized sensors determine the amount of air displaced by the person’s body.
Dual energy X-ray absorptiometry (DEXA) uses two low-dose X-rays that differentiate among fat-free soft tissue (lean body mass), fat tissue, and bone tissue, providing a precise measurement of total fat and its distribution in all but extremely obese subjects.