Download
1 / 16
170 likes | 177 Vues
An Investigation of Techniques to Predict and Quantify Stormwater Chemical Concentrations in a Karst Aquifer System Rachel Grand 11 December 2003. Karst aquifers are notably different from other types of aquifers .

E N D
An Investigation of Techniques to Predict and Quantify Stormwater Chemical Concentrations in a Karst Aquifer System Rachel Grand 11 December 2003
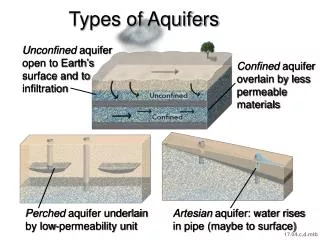
Karst aquifers are notably different from other types of aquifers. Karst systems are characterized by highly soluble bedrock, generally either limestone or dolomite. As such, the aquifer has open-conduit flow, from fractures, as well as dissolution features, such as sinkholes and caves. These aquifers also have diffuse flow.
Figure 1: Karst aquifer cross section. From http://www.forester.net/images/sw0111_49.gif
Because of the open, fractured nature of karst, surface contamination can impact these aquifers. Understanding and quantifying this surface contamination is important for a variety of water-quality issues.
Sources and Paths of Contamination in a Karst Aquifer Figure 2: Contamination in a karst aquifer. From http://www.dyetracing.com/karst/ka01013.html
Techniques for Predicting Nitrate Concentration through a Storm Event • Visual Inspection of storm hydrograph • Multiple Regression using stage and SC as a proxy for nitrates • Step Multiple Regression using stage and SC as a proxy for nitrates
Multiple Regression • Single equation generated to model nitrate behavior • Stage and SC are the variables • Nitrates are the response • To be an effective technique, p-values must be below -level (generally 0.05) • R-squared values should be high enough to explain majority of variability
Step Multiple Regression • Sort stage data and plot versus nitrates • Identify obvious slope changes
Step Multiple Regression, continued • After identifying steps, generate a multiple regression equation for each step • P-values must be below -level • R-squared values must explain a majority of the variability • Plot equations and compare to actual nitrate levels
Multiple Regression Plot (no steps) Data from Peterson, Davis and Brahana, 2000.
Why Did These Techniques Not Work? • Alarger data set may produce more reliable regression equations. • Determining what makes an obvious slope change is not a quantifiable evaluation, and is subject to individual interpretation. • Peterson, Davis and Brahana conclude that the step regression methods work best for springs fed primarily by diffuse flow (2000, p. 61). • It is quite possible that Millstone Spring is supplied by conduit flow instead. • It may be that the aquifer must be profoundly impacted (by intensive agricultural use, for example) to be predictable using this model.
Works Cited Croft, A., 2003, Introduction to Karst Environmental Problems, http://www.dyetracing.com/karst/ka01013.html Forester Communications, 2003, Karst Cross-Section, http://www.forester.net/images/sw0111_49.gif Peterson, E.W., Davis, R.K. and Brahana, J.V., 2000, The use of Regression Analysis to Predict Nitrate-Nitrogen Concentrations in Springs of Northwest Arkansas, in Sasowsky, I.D. and Wicks, C.M. (eds), Groundwater Flow and Contaminant Transport in Carbonate Aquifers, A.A. Balkema, Rotterdam, p.43-63. In addition to the sources listed below, the statistical programs MINITAB, PSI-Plot and Excel were used in the analysis of the data. Dr. Dorothy Vespers provided the chemical data for Millstone Spring.