Chapter 9. Nuclear Analysis Methods Neutron Activation Analysis Accelerator Mass Spectrometry
600 likes | 1.1k Vues
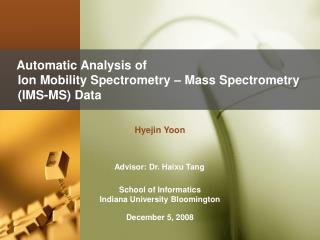
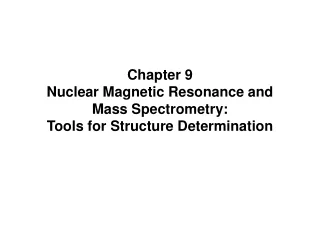
Chapter 9. Nuclear Analysis Methods Neutron Activation Analysis Accelerator Mass Spectrometry M ö ssbauer Spectroscopy Ion Beam Analysis. The Neutron Activation Analysis Method. 中子活化分析. Material for NAA. Neutron Source. Prompt g rays. Material original. b rays.

Chapter 9. Nuclear Analysis Methods Neutron Activation Analysis Accelerator Mass Spectrometry
E N D
Presentation Transcript
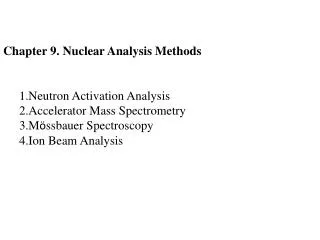
Chapter 9. Nuclear Analysis Methods • Neutron Activation Analysis • Accelerator Mass Spectrometry • Mössbauer Spectroscopy • Ion Beam Analysis
The Neutron Activation Analysis Method 中子活化分析 Material for NAA Neutron Source Prompt g rays Material original b rays radioactive nuclides g rays Data analysis and results reporting Gamma-ray spectrometer Block diagrams of the NAA method
Chinese NAA Facilities China Institute of Atomic Energy 中国原子能科学研究院 Institute of High Energy Physics, Chinese Academy of Science中国科学院高能物理研究所 …
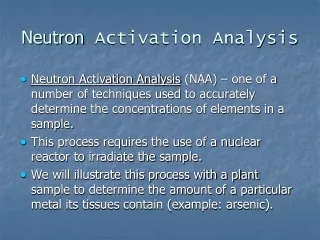
What is NAA? • Hit source with neutrons • Sources become radioactive • Then decay in predictable ways The activity A of the sample increases with bombarding time t
How? • Detect the gamma-rays (prompt and delayed) - with gas detector, scintillators, semiconductors • Bin number of counts at each energy An example of gamma-ray spectrum from the activation of a human nail
Neutron sources • A nuclear reactor • A source that emits neutrons by fission (e.g. Californium) • Alpha Source (like Radium) with Beryllium • D-T fusion in a gas discharge tube
Applications • Determine the chemical composition of a sample • Lunar samples, artifacts, forensics • Can identify up to 74 different elements in gases, liquids, solids, and mixtures • Can also determine the concentration of the elements of interest:
Advantages • Small sample sizes (.1mL or .001gm) • Non-destructive • Can analyze multiple element samples • Doesn’t need chemical treatment • High sensitivity, high precision
Limitations • Interferences can still occur when different component sample elements produce similar gamma rays. • The detection limit • bulk matrix
Take sample to the rabbit system apparatus • The rabbit system works much like the system used by banks at drive-through windows. A canister carries items back and forth between the customer and teller. • The sample is sent through the wall in a mini canister into the nuclear reactor located behind the wall. • Once inside the reactor, the sample is irradiated with neutrons.
After irradiation of the sample in the capsule, and before removing it from the reactor site, it must be determined if the capsule is safe for transfer. A Geiger counter is used to assess whether the radioactive decay has reached low enough levels to be safe.
The prepared sample and standard sample are placed in a “detector” one at a time. • The detector system counts and records gamma radiation emissions for a period of time. • Time varies, but is usually in the range of 5 minutes to an hour.
Specialized software analyzes radiation peaks. Peak data is correlated to specific elements for identification and quantification.
Neutron Activation Analysis (NAA) Neutron activation analysis is a multi-, major-, minor-, and trace-element analytical method for the accurate and precise determination of elemental concentrations in materials. Sensitivity for certain elements are below nanogram level. The method is based on the detection and measurement of characteristic gamma rays emitted from radioactive isotopes produced in the sample upon irradiation with neutrons. High resolution germanium semiconductor detector gives specific information about elements.
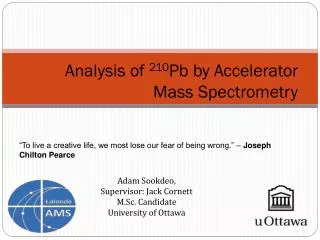
2. Accelerator Mass Spectrometry • prior to AMS samples were 14C-dated by counting the number of decays • - required large samples and long analysis times • -1977: Nelson et al. and Bennett et al. publish papers in Science demonstrating • the utility of attaching an accelerator to a conventional mass spectrometer • Principle: • You cannot quantitatively remove interferring ions to look for one 14C atom among several quadrillion C atoms. • Instead, you • destroy molecular ions (foil or gas) • filter by the energy of the ions (detector) to separate the needle in the haystack.
c) ACCELERATOR generates 2.5 million volts, accelerates C- ions b) INJECTOR MAGNET separates ions by mass, masses 12, 13, and 14 injected d) TERMINAL C- ions interact with ‘stripper’ gas Ar, become C+ ions, molecular species CH destroyed e) ELECTROSTATIC DEFLECTOR specific charge of ions selected (3+) a) ION SOURCE generates negative carbon ions by Cs sputtering f) MAGNETIC SEPARATION 13C steered into cup, 14C passes through to solid detector g) Si BARRIER DETECTOR pulse produced is proportional to the energy of ion, can differentiate b/t 14C and other ions count rate for modern sample = 100cps http://www.physics.arizona.edu/ams/education/ams_principle.htm
Hurdles in mass spectrometry 1) Abundance sensitivity - ratio of signal at mass m to signal at m+1 - better with better vacuum - acceptable values: 1-3ppm at 1amu 2) Mass discrimination - heavier atoms not ionized as efficiently as light atoms - can contribute 1% errors to isotope values - can correct with known (natural) isotope ratios within run, or with known standards between runs
Hurdles in mass spectrometry (cont.) 3) Dark Noise - detector will register signal even without an ion beam - must measure prior to run to get “instrument blank” if needed 4) Detector “gain” - what is the relationship between the electronic signal recorded by the detector and the number of ions that it has counted? - usually close to 1 after factory calibration - changes as detector “ages” - must quantify with standards Cardinal rule of mass spectrometry: Your measurements are only as good as your STANDARDS!
Chapter 9. Nuclear Analysis Methods • Neutron Activation Analysis • Accelerator Mass Spectrometry • Mössbauer Spectroscopy • Ion Beam Analysis • Synchrotron Radiation Facility
Free emitting and absorbing atoms γ-ray energy Energy of recoil Mass of atom
Emitting and absorbing atoms fixed in a lattice Mössbauer spectroscopy is the recoil-free emission and absorption of gamma rays Mass of particle
Appearance of Mössbauer spectra Depending on the local environments of the Fe atoms and the magnetic properties, Mössbauer spectra of iron oxides can consist of a singlet, a doublet, or a sextet. Magnetic hyperfine field Quadrupole splitting Isomer shift δ Δ Bhf Symmetric charge No magnetic field Asymmetric charge No magnetic field Symmetric or asymmetric charge Magnetic field (internal or external)
Use of Mössbauer spectroscopy as a “fingerprinting” technique Isomer shifts and quadrupole splittings of Fe-bearing phases vary systematically as a function of Fe oxidation, Fe spin states, and Fe coordination. Knowledge of the Mössbauer parameters can therefore be used to “fingerprint” an unknown phase.
Elements of the periodic table which have known Mössbauer isotopes (shown in red font). Those which are used the most are shaded with black
Sensitive only to 57Fe (no matrix effects) Sensitive to oxidation state Allows distinction of magnetic phases Very sensitive towards magnetic phases Non-destructive Resolution limited by uncertainty principle Sensitive only to 57Fe (“sees” only 57Fe) Coordination ? to ± Paramagnetic phase data often ambiguous Diamagnetic element substitution & relaxation Slow If possible, use other techniques as well Strengths and weaknesses of 57Fe Mössbauer spectroscopy Strengths Weaknesses Often a combination of Mössbauer spectroscopy with other techniques can help solve problems that cannot beresolved using Mössbauer spectroscopy alone.
Chapter 9. Nuclear Analysis Methods • Neutron Activation Analysis • Accelerator Mass Spectrometry • Mössbauer Spectroscopy • Ion Beam Analysis RBS, PIXE • Synchrotron Radiation Facility
Rutherford Backscattering (RBS) is • Elastic scattering of protons, 4He, 6,7Li, ... ≠ Nuclear Reaction Analysis (NRA): Inelastic scattering, nuclear reactions ≠ Detection of recoils: Elastic Recoil Detection Analysis (ERD) ≠ Particle Induced X-ray Emission (PIXE) ≠ Particle Induced γ-ray Emission (PIGE) • RBS is a badly selected name, as it includes: - Scattering with non-Rutherford cross sections - Back- and forward scattering • Sometimes called Particle Elastic scattering Spectrometry (PES)
History 1970’s: RBS becomes a popular method due to invention of silicon solid state detectors • 1977: H.H. Andersen and J.F. Ziegler Stopping Powers of H, He in All Elements • 1977: J.W. Mayer and E. Rimini Ion Beam Handbook for Materials Analysis • 1979: R.A. Jarjis Nuclear Cross Section Data for Surface Analysis • 1985: M. Thompson Computer code RUMP for analysis of RBS spectra • 1995: J.R. Tesmer and M. Nastasi Handbook of Modern Ion Beam Materials Analysis • 1997: M. Mayer Computer code SIMNRA for analysis of RBS, NRA spectra
2. RBS i, Kinematic factor: ii,
su is a product of three factors: su = sS •wS•ru where sS = S-shell ionization cross section (S = K, L, M, …), wS = fluorescence yield, ru = transition probabiliy. 4.2 PROTON INDUCED X-RAY EMISSION (PIXE) X-ray production cross-section su
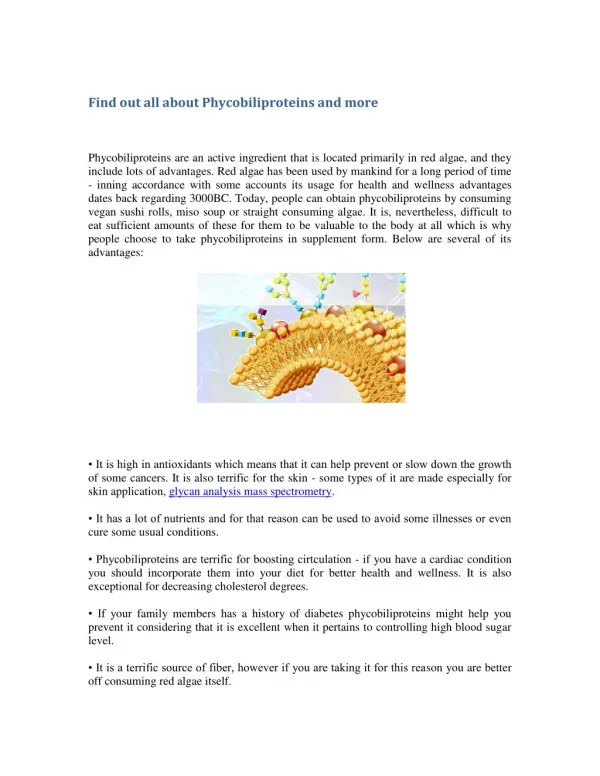
as can been seen from the spectrum, which is obtained from a lung tissue taken from a patient suffered from hard metal lung disease: Si(Li) X-ray Target X-ray X-ray counts protons Eo X-ray X-ray energy (kev) X-ray A PIXE spectrum consists of two components: peaks due to characteristic X-rays, & a background continuum,
The number of counts under the X-ray peak corresponding to the principal characteristic X-ray line of an element is called the yield (Yu ) for the u - line. It is a product of 5 quantities: Yu = • Np• nz•su•eu 4 The X-ray yield Where = solid angle subtended by the detector at the target, Np = number of incident protons that hit the specimen, nz = number of sample atoms per unit area of the specimen, z is the atomic number of the element, su = production cross-section for u - line x-rays, eu = detection efficiency for u - line x-rays.
DETERMINATION OF Np The knowledge on the number of protons that hit the specimen in a PIXE measurement is required for quantitative PIXE analysis. Np can be measured directly or indirectly. As protons are positively charged, Np is often measured by charge integration and quoted in units of micro-Coulombs (or mC). The charge carried by a proton is 1.60210 x 10⁻¹⁹ Coulombs. The charge carried by Np protons is therefore: Qp = 1.60210 x 10⁻¹³ x Np mC
DETERMINATION OF Np Use of a Faraday cup coupled to a charge integrator. Use of rotating vane or chopper which periodically intercepts and samples the proton beam. Measuring the back-scattered protons from the specimen
Detection efficiency e The detection efficiency of a Si(Li) X-ray detector is dependent on the X-ray energy. It is usually determined theoretically using the parameters (i.e. thicknesses of Si diode, Be window, gold contact and Si dead layer) provided by the detector manufacturer. However, calibration standards (targets containing one or more elements of known concentrations) are often used to determined e experimentally.
ds dE SOURCES OF BACKGROUND 1. bremsstrahlung 1000 100 10 1 Total SEB Ee=4meE/M p-bremsstrahlung 0 2 4 6 8 10 12 X-ray Energy (keV)
SOURCES OF BACKGROUND (P,γ) Cosmic rays Insulating samples Substrate
DETECTION LIMITS The detection limits for the various elements in PIXE are determined by the sensitivity factors on one hand, and on the other hand by the spectral background intensity where the element signal is expected. It is now a general practice to define the detection limit, DLz for an element Z as the amount of the element that gives rise to a net peak intensity equal to 3 times the standard deviation of the background intensity, NB, in the spectral interval of the principal X-ray line, i.e. DLz = 3 std. dev. (NB) 3 (NB)½