Download
1 / 7
70 likes | 140 Vues
Explore the dynamic transformation of education at SFC through statistical data, strategic objectives, and task force recommendations. Witness the shift in labor trends, graduation rates, and student goals as the institution embraces innovation and community building.

E N D
Co-Chair of Committee Six Peter Mohn Library Media Specialist SFC
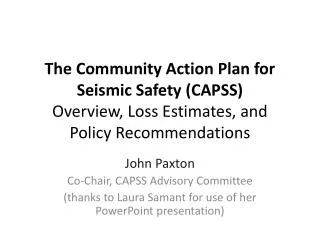
Industrial Revolution Material Production Machine Powered Manufacturing Individual Competition Information Age Knowledge Develop. Cybernetics-Systems Information/Networking Team Building Societal Changes
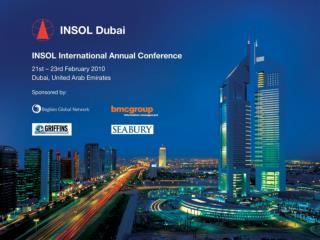
1950 30% Skilled Labor 70% Unskilled Labor 2002 85% Skilled Labor 15% Unskilled Labor Workforce Statistics
Percent of H.S. Grads Going to Higher Education Institutions • 1950 - 10% • 1975 - 25% (18% 4 year; 7% 2 year) • 2001 - 60% (33% 4 year; 27% 2 year) • 2001 - Snohomish rate - estimated at 50% (20% 4 year; 30% 2 year)
U. S. H.S. Graduation Rates • 1900 - 6% • 1949 - 49% • 2001 - 76%-82% (depends how it is calculated) • 2001 - Snohomish rate = 80.1% (on-time rate)
SHS Objectives • By 2008, 80% of all students will meet or surpass all state academic mandates. • All students will have a feeling of connectedness and belonging at SHS... • All students shall see the relevance and meaning in their experiences at SHS... • All members of the SHS learning community will demonstrate outstanding character and citizenship… • Our students at SHS will meet our district’s goals ...
9-12 Task Force Recommendations • Completing a transition to integrated 9-12 programs by 2002-2003 • Reconfiguring our use of facilities and staffing to acquire the best attributes of smaller schools • Establishing a structure that allows students to have a sustained relationship with at least one caring adult … • Developing a schedule to minimize daily transitions, to maintain or increase academic contact time, and to create an opportunity for students & teachers to work with fewer classes • While maintaining academic excellence, develop formal & informal learning opportunities ...