Flow Measurements Instruments and Techniques
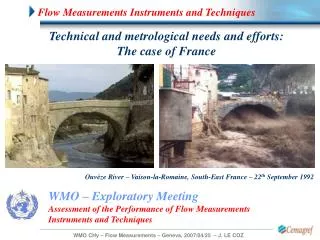
Flow Measurements Instruments and Techniques. Technical and metrological needs and efforts: The case of France. Ouvèze River – Vaison-la-Romaine, South-East France – 22 th September 1992. WMO – Exploratory Meeting Assessment of the Performance of Flow Measurements Instruments and Techniques.

Flow Measurements Instruments and Techniques
E N D
Presentation Transcript
Flow Measurements Instruments and Techniques Technical and metrological needs and efforts: The case of France Ouvèze River – Vaison-la-Romaine, South-East France – 22th September 1992 WMO – Exploratory Meeting Assessment of the Performance of Flow Measurements Instruments and Techniques
Summary • River flow measurements in France • floods, rivers and uses • hydrometric services • needs for methodology and metrology • Assessment of the instruments and techniques performance • uncertainties associated with various gauging methods • field tests and aDcp regattas • rating curves: uncertainty assessment and extension • Research on innovating methods • acoustic Doppler current profilers (aDcp, Groupe Doppler) • discharge monitoring systems • projects for video-based field measurements (LS-PIV)
Flow Measurements Instruments and Techniques • River flow measurements in France • floods, rivers and uses • hydrometric services • needs for methodology and metrology
Floods, rivers and uses in France • Floods = the most damaging natural hazard in France • River habitats: min. flow rates and max. water temperature (EU WFD 2000) • Most of the large rivers are regulated (excepted the Allier-Loire rivers) Lyon flooded by the Saône river in 1856 • Uses: water supply, industry, agriculture (irrigation), power generation (hydropower, cooling of nuclear power plants), navigation, tourism...
Gard River, St-Nicolas Bridge, September 2002 Floods, rivers and uses in France • Specific technical challenges: • Influenced reaches (tides, shipping...) • Flash floods: • Mediterranean belt • French tropical islands • (Martinique, Guadeloupe, La Réunion…) 27 m Borne river (Ardèche catchment)
The French galaxy of flow measurement • National hydrometric network • Regional Environment Agencies (DIREN), Flood Forecast Services (SPC and SCHAPI), Ministry of Environment (MEDD), MétéoFrance • Hydropower industry • Electricité de France (EDF), Compagnie Nationale du Rhône (CNR) • Waterways office • Voies Navigables de France (VNF), Ministry of Infrastructure • Research institutes and laboratories • Cemagref, IRD (Brazil, Africa...), LTHE, CEREGE, universities... Source: MEDD/DE/SCHAPI 2006
The French galaxy of flow measurement Real-Time Flood Forecast (SPC/SCHAPI/MEDD) www.vigicrues.ecologie.gouv.fr 4 warning levels Source: MEDD/DE/SCHAPI 2007
Needs for methodology and metrology • Accurate river flow measurements are requested for • hydrological research and studies • human uses (water supply, power plants, agriculture, …) • river management (flood risk, habitats…) • Technical and metrological difficulties • field deployment conditions (floods, night…) • rating curves: uncertainty assessment and extension • uncertainties associated with various gauging methods • Innovating methods bring new solutions… and new problems! • need for standard procedures (field operations and data processing) • comparison with classical methods (and subsidiarity) • performance, limitations and uncertainty assessment Source Cemagref Lyon
Flow Measurements Instruments and Techniques • 2. Assessment of the instruments and techniques performance • uncertainties associated with various gauging methods • field tests and aDcp regattas • rating curves: uncertainty assessment and extension
Uncertainties associated with various gauging methods • U(Q)=5-7% for current-meter discharges (ISO 748 & NF ENV 13005 “GUM”) • Current-meter and aDcp gauging comparison (CNR/Cetiat) Olivier et al. 2006, CNR/Cetiat Estimation des incertitude sur les débits des écoulements à surface libre déterminés par jaugeage à l'ADCP ou au moulinet - 13ème Congrès International de Métrologie (Lille, France)
UADCP / QADCP UCM / QCM Uncertainties associated with various gauging methods • QADCP uncertainty from comparison with current-meter (QCM ) (CNR/Cetiat, NF ENV 13005) U = bias + k * reproducibility = 7.9 % (k=2) UADCP = 4-6 % Olivier et al. 2006, CNR/Cetiat Estimation des incertitude sur les débits des écoulements à surface libre déterminés par jaugeage à l'ADCP ou au moulinet - 13ème Congrès International de Métrologie (Lille, France)
Field tests and aDcp regattas • Comparison tests performed by the different services (EDF/CNR/MEDD…) • Results for aDcp’s are being collected by the Groupe Doppler • Wide and open diffusion of the results (Internet?) Source EDF-DTG Grenoble • Need for accepted protocols and comparison standards • suitable site (gauging requirements, logistics, safety…) • reference discharge values and hydrodynamical conditions • parameter configuration and deployment procedures (Ntransect = 6) • interpretation of the results Vignon 2006, EDF-DTG Comparaison des mesures avec divers ADCP: Broad-Band, Rio-Grande, Streampro (rapport technique)
Rating curves: uncertainty assessment Uncertainty assessment based on standard NF ENV 13005 "Guide for the expression of the Uncertainty of Measurement" (1999) Rhône at Beaucaire (1994-2003, 54 gauging values) U(Q) = 8-10% Olivier et al. 2006, CNR Incertitude sur les débits calculés à partir des courbes de transformation hauteur/débit
Rating curves: extension • A review of a set of 327 rating curves (Cemagref/MEDD, 2005-2006) T < 1 yr (53%) 1 < T < 2 yr (7%) 2 < T < 10 yr (31%) 10 < T < 100 yr (8%) T > 100 yr (1%) Lang et al. 2006, Cemagref Review on the rating curves of the national French database (HYDRO) for flood discharge – 5th FRIEND World Conference
Rating curves: extension High-discharge extension based on hydraulic modelling (1D/2D) Hérault river at Ganges-Laroque Relative error : dQ/Q=20 to 30% Lang et al. 2006, Cemagref Review on the rating curves of the national French database (HYDRO) for flood discharge – 5th FRIEND World Conf.
Flow Measurements Instruments and Techniques • 3. Research on innovating methods • acoustic Doppler current profilers (aDcp, Groupe Doppler) • discharge monitoring systems • projects for video-based field measurements (LS-PIV)
The “Groupe Doppler” • A forum for French aDcp users (2005, CNR/MEDD/EDF) • Technical solutions, mobile bed! • Metrological tests and comparisons • aDcp methodological guide (2007?) Photos: DIREN RA & CNR Le Coz et al. 2007, Cemagref Uses of aDcp in rivers: a review (in French) – La Houille Blanche ADcp river discharge measurement: sharing experience (in French) – La Houille Blanche
VLSPIV Water level Bathymetry profile Discharge monitoring systems • From continuous velocity sampling to discharge time series: • Transit time ultrasonic systems • Doppler flow-meters (small streams) • Horizontal aDcp (H-aDcp) • Radar Bragg diffraction • Video-based velocimetry (LS-PIV) • Quality of velocity estimates • Assumptions on the velocity field structure
Doppler flow-meters (small streams) Birgand, Benoist et al. 2005, Cemagref Mesure des débits à l’aide de débitmètres ultrasoniques Doppler - Cas des petits cours d’eau ruraux, Ingénieries – EAT, 41, 23-38 Correlation between the mean velocity (Vm=Q/S) and the flow-meter velocity (Vc)
Uncertainty u(S) in % Water depth h [metres] Doppler flow-meters (small streams) Estimation of the section area uncertainty for sections with different batter slopes: <23° (A&B) vs. 40° (C&D)
Doppler flow-meters (small streams) Relative discharge error (%) at 4 Doppler flow-meter stations (against standard stream discharge measurements)
Streamwise velocity Width 75 m 24h (time step = 1 min) St-Georges H-aDcp (CNR, Saône river, Lyon) Influence of downstream dam (backwater) 3 beam H-aDcp 300 kHz (TRDI) Q computed from point velocity measurements through a theoretical vertical profile Parameters : z0 and A1 (VISEA-H; Van Rijn, 1986)
St-Georges H-aDcp: aDcp dataset postprocessing z/h0 u/<uref> Experimental unit profile ( z0 , A1 ) Surface coefficient (α=0.91±0,04) H-aDcp vs. aDcp: DQ/Q <3% Le Coz et al. 2007, Cemagref/CNR Mean vertical velocity profiles from aDcp river discharge measurement datasets – 32nd Congress of IAHR (Venice, Italy)
St-Georges H-aDcp: performance evaluation uaH-aDcp/uaDcp Distance from H-aDcp [m] Problems: far-field, low flows… Empirical regressions (index velocity) Metrological analysis in progress Le Coz et al. 2007, Cemagref/CNR Experimental evaluation of a horizontal Doppler profiler (H-aDcp) – HMEM07 (Lake Placid, USA)
Projects for video-based field measurements (LS-PIV) • Principle of operation: tracking surface movements by image analysis • Geometric correction of images: surface velocities from [pixels/s] to [m/s] • Discharge computation from bathymetry profile and hydrodynamical assumptions on the velocity field structure • Performance assessment and potential error sources • Non-contact discharge monitoring (flash-floods!) • Collaboration: IIHR (Iowa City), LTHE (Grenoble) and Cemagref (Lyon) • Iowa City LS-PIV station (IIHR, M. Muste, A. Hauet...) • Tests in 2005-2006 (LTHE/Cemagref) : Arc river • The Ardèche river project 2007-2008 (LTHE/Cemagref/CNR/SPC-GD) • Other application opportunities in France: Ain river, Guadeloupe Island, etc.
LS-PIV : tests during a dam release (Arc 2006) LS-PIV surface velocities & gauging transect Artificial tracers (cornstarch chips) 10-m high mast & remotely controlled video camera
77 m3/s 113 m3/s LS-PIV : tests during a dam release (Arc 2006) LS-PIV and simulated (Rubar20 code) velocities Q_currentmeter (blue dots) Q_LSPIV (red dots) Q_rating curve (solid line) Jodeau, Hauet et al. 2007, Cemagref/LTHE/IIHR LSPIV technique to measure surface flow velocities during a reservoir flushing – HMEM07 (Lake Placid, USA)
Flow Measurements Instruments and Techniques Thanks for your attention.