Download
1 / 2
20 likes | 145 Vues
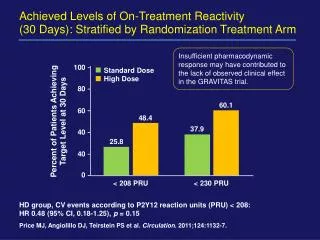
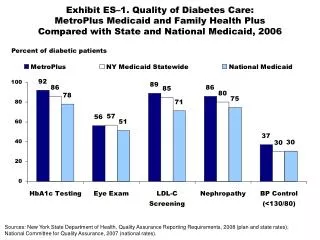
This study investigates the relationship between on-treatment reactivity, pharmacodynamic responses, and clinical efficacy in the GRAVITAS trial. It highlights the differences in treatment groups—Standard Dose vs. High Dose—regarding the percentage of patients achieving target levels at 30 days. The findings suggest that insufficient pharmacodynamic response may have played a role in the limited clinical effect observed. Furthermore, hazard ratios for cardiovascular events correlated with various PRU levels are analyzed, offering insights into the impact of treatment on patient outcomes.

E N D
Achieved Levels of On-Treatment Reactivity (30 Days): Stratified by Randomization Treatment Arm Insufficient pharmacodynamic response may have contributed to the lack of observed clinical effect in the GRAVITAS trial. 100 Standard DoseHigh Dose 80 60.1 60 Percent of Patients Achieving Target Level at 30 Days 48.4 37.9 40 25.8 40 0 < 208 PRU < 230 PRU HD group, CV events according to P2Y12 reaction units (PRU) < 208:HR 0.48 (95% CI, 0.18-1.25), p = 0.15 Price MJ, Angiolillo DJ, Teirstein PS et al. Circulation. 2011;124:1132-7.
On-Treatment Reactivity as a Time-Varying Covariate: Unadjusted Hazard of CV Death, MI, and ST HR (95% CI) p-value 60 Days < 230 PRU 0.62 (0.25-1.51) 0.30 < 208 PRU 0.18 (0.04-0.79) 0.20 0.01 0.1 1 10 Hazard Ratio 6 Months HR (95% CI) p-value < 230 PRU 0.71 (0.41-1.23) 0.20 < 208 PRU 0.43 (0.23-0.83) 0.01 0. 1 1 10 Hazard Ratio PRU: P2Y12 reaction units Price MJ, Angiolillo DJ, Teirstein PS et al. Circulation. 2011;124:1132-7.


![Target Profit Price = total costs [at Level X] + Target profit](https://cdn3.slideserve.com/6116031/slide1-dt.jpg)