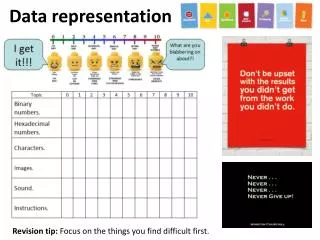
Data Representation Strand: Statistics
Math 20-2. Data Representation Strand: Statistics. Ashley G., Hafsah , Sandra January 26, 2012. Big Idea. #19: Data Representation: Data can be represented visually using tables, charts, and graphs. The type of data determines the best choice of visual representation. . Prerequisites.

Data Representation Strand: Statistics
E N D
Presentation Transcript
Math 20-2 Data RepresentationStrand: Statistics Ashley G., Hafsah, Sandra January 26, 2012
Big Idea • #19:Data Representation: Data can be represented visually using tables, charts, and graphs. The type of data determines the best choice of visual representation. Prerequisites • Grade 7: Statistics and Probability: Outcomes 1 and 2 • Demonstrate an understanding of central tendency and range • Determine the effect on the mean, median and mode when an outlier is included in a data set • Grade 8: Statistics and Probability: Outcome 1 • Critique ways in which data is presented in circle graphs, line graphs, bar graphs and pictographs
Activity: Graphing Data • Students will split themselves into groups based on their learning styles (Sensory, Visual, Sequential, Active) • Each learning style has a different station • Each station is equipped with the required materials to complete the activity • Each station will be completing the exact same questions as other groups but with their chosen learning style • If time permits, students will be able to change stations
Nature of Mathematics • Change (the way data is represented) • Constancy (values) • Number Sense (choosing and calculating scales) • Patterns (within graphs and comparing) • Relationships (independent vs. dependent variables) • Spatial Sense (graphs) ICT Outcomes • ICT: C1-4.2, C2-4.2, C6-4.1, C7-4.2 • Technology • Problem solving • Alternative views • Justification • Personal meaning
Mathematical Processes • Communication • Connections • Problem Solving • Reasoning • Technology • Visualization
Differentiation • Maximizes the capacity of each learner by teaching in ways that helps all learners build gaps in understanding and skill(Tomlinson, pp. 6.) • Student readiness, interest, and learning profile • Content, Process, and Product Application • Review of prior knowledge • Motivation levels addressed • Felder and Silverman’s Index of Learning Styles from the Mind Tools website • Questions are based on possible student interests • Students can choose certain activities based on learning styles presented
Cooperative Learning • Promote positive interdependence • Facilitate each others efforts • Ensure a student centered approach to teaching • Not having students sit by each other while working independently Application • Teacher reinforcement on entire group collaboration (ex: over-the-shoulder approach)
Enactivism/Active Learning • Engaged in activities • Emphasis on development of student skills • Exploration of attitudes and values • Increased motivation • Receiving immediate feedback from instructor • Higher order thinking • “All genuine learning is active, not passive. It is a process of discovery in which the student is the main agent, not the teacher” (Alder, 1982)
Assessment • Collaboration/group work • On task behavior • Justification of graphs used and outliers • Quality of graphs • Assessment will be formative • Graphs can be handed in for detailed teacher feedback
LESSON …and so it begins…
Review • Refer to handout for graph descriptions • Outlier: a value in a data set that is very different from other values in the set • To compare sets of data, the data must be organized in a systematic way (ex: stem-and-leaf) • The interval width can be determined by dividing the range of the data by the desired number of intervals and then rounding to a suitable width
Activity: Graphing Data • Students will split themselves into groups based on their learning styles (Sensory, Visual, Sequential, Active) • Each learning style has a different station • Each station is equipped with the required materials to complete the activity • Each station will be completing the exact same questions as other groups but with their chosen learning style • If time permits, students will be able to change stations
Learning Styles • Sensory: Sensory learners prefer concrete, practical, and procedural information. They look for the facts. Go to Station 1. • Visual: Visual learners prefer graphs, pictures, and diagrams. They look for visual representations of information. Go to Station 2. • Active: Active learners prefer to manipulate objects, do physical experiments, and learn by trying. They enjoy working in groups to figure out problems. Go to Station 3. • Sequential: Sequential learners prefer to have information presented linearly and in an orderly manner. They put together the details in order to understand the big picture emerges. Go to Station 4.
Stations • Station 1 (Sensory): Concrete: Students will be given graph paper and graph the data ‘the old fashioned way.’ Pencil crayons will be supplied to color the graphs. Also, a geometry set will be supplied to construct the pie chart and straight lines. • Station 2 (Visual): Smart Board: Students will graph the data on pre-existing Smart Notebook templates. They can write the stem-and-leaf plots on either the question sheet or a separate piece of paper. They will be able to use the technology to manipulate the graphs.
Stations • Station 3 (Active):Manipulative: Using supplies provided, students will create graphs using a ‘hands on’ approach. Scatter plot will be represented using grid paper and candy, bar graphs and histograms can be constructed with unit blocks and/or candy, and pie charts will be demonstrated using construction paper, scissors, and glue. • Station 4 (Sequential):Excel: students will have to be able to put the data on Excel and use the technology to present the data graphically. They will be given a set of instructions on how to use Excel.
Review • Refer to handout for graph descriptions • Outlier: a value in a data set that is very different from other values in the set • To compare sets of data, the data must be organized in a systematic way (ex: stem-and-leaf) • The interval width can be determined by dividing the range of the data by the desired number of intervals and then rounding to a suitable width
Misconceptions • Misunderstanding of dependent and independent variables • When to use which type of graph • Interval width and scale • Data organization • Determining outliers and why they exist