Statistics: Representation of Data
Statistics: Representation of Data. Definition of Statistics: The science of producing unreliable facts from reliable figures. Evan Esar Read more: http://www.brainyquote.com/quotes/keywords/statistics.html#ixzz1JQITwxvL. Scatterplots & Correlation.

Statistics: Representation of Data
E N D
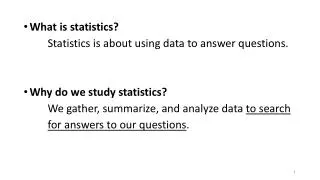
Presentation Transcript
Statistics: Representation of Data Definition of Statistics: The science of producing unreliable facts from reliable figures. Evan EsarRead more: http://www.brainyquote.com/quotes/keywords/statistics.html#ixzz1JQITwxvL
Scatterplots & Correlation Read the information on this website, http://www.regentsprep.org/Regents/math/ALGEBRA/AD4/scatter.htm, and write definitions of the following terms. Include a diagram for each. Correlation Positive correlation Negative correlation No correlation
Practice Problem #1 Check Answer A dentist kept a record of the number of new cavities his patients had per year for the last 10 years. The scatterplot below shows the average number of new cavities per year for patients in the 4 to 32-year age range. Which description best represents the relationship of the dentist's data? A. Negative trend B. No trend C. Positive trend D. Cannot be determined
Practice Problem #2 Check Answer The scatterplot below shows the cost of phone calls Betsy made to her brother overseas in relation to the number of minutes per phone call. Based on the information in the scatterplot, which statement is a valid conclusion? A. As Betsy made more phone calls, the cost of the phone calls increased. B. As Betsy made fewer phone calls, the cost of the phone calls decreased. C. As Betsy decreased the number of minutes on the phone, the number of phone calls decreased. D. As Betsy increased the number of minutes on the phone, the cost of the phone calls increased.
Practice Problem #3 Check Answer The scatterplot below shows the cost of 9 large countertop microwave ovens and their capacity in cubic feet. Which best describes the trend shown in the scatterplot? A. Positive trend B. Negative trend C. Mean trend D. No trend
Graphical Representations of Data You must be able to select and use an appropriate representation for presenting and displaying relationships among collected data, including line plots, line graphs, stem and leaf plots, circle graphs, bar graphs, box and whisker plots, histograms, and Venn diagrams, with and without the use of technology. Click on the name of each graph listed above to learn what they are and how to use them. On your paper, write the definition and draw a diagram of each.
Practice Problem #4 Check Answer The manager of a sandwich shop is planning to make a circle graph showing the types of sandwiches sold in one day. The table below summarizes these data. What central angle should the manager use for the section representing the ham-and-cheese sandwich? A. 2700 B. 750 C. 540 D. 150
Practice Problem #5 Check Answer Which histogram best reflects the data shown in the table? A. B. C. D.
Practice Problem #6 Check Answer The student election committee at Chesterfield High School recorded the number of votes that each of 4 presidential candidates received in the student council election. A total of 240 students voted. Charlene received 12.5% of the votes; Jimmy received 33.3%; Stephen received 16.7%; and Lupe received 37.5%. Which bar graph best represents the number of votes each presidential candidate received in the student council election? A. B. C. D.
Practice Problem #7 Check Answer An orange-drink label reads "20% real fruit juice." The other ingredients are water, sugar, and flavoring. Which section of the circle graph best represents the amount of real fruit juice in the orange drink? A. W C. Y B. X D. Z
Practice Problem #8 Check Answer Luke’s math scores for this grading period are listed below. 84, 86, 83, 78, 92, 87, 92, 90, 88, 86, 82, 90 Which line plot correctly shows his scores? A. B. C. D.
Practice Problem #9 Check Answer A county commissioner surveyed the farmers in her county about the crops they grow. The results of the survey are shown below. • A total of 13 farmers grow cotton. • A total of 14 farmers grow wheat. • A total of 20 farmers grow corn. Some farmers in the list above grow more than 1 crop. Exactly 3 of the farmers in the list above said that they grow all 3 crops. Which of the following Venn diagrams could not represent this situation? A. B. C. D.
Practice Problem #10 Check Answer There were 200 students who voted for a class color. The results are shown in the graph. Based on the information in the graph, which table represents the actual number of votes for each color? A. B. C. D.
Validity in Sampling The student evaluates predictions and conclusions based on statistical data. The student is expected to evaluate methods of sampling to determine validity of an inference made from a set of data. When conducting a survey, it’s not usually feasible to survey all of the people in the population, so a sample of the population is chosen. A good sample must be chosen in order for the results to be valid and representative of the entire population.
Sampling Methods The sample reflects the characteristics of the population from which it is drawn. Sampling methods include… Random sampling: Each member of the population has an equal and known chance of being selected. Systematic sampling: After the required sample size has been calculated, every Nth record is selected from a list of population members. No matter the method used, the results should accurately reflect the beliefs of the entire population.
Example If you want to find out which elective class is most preferred by students, your sample should include students in all electives. Therefore, you shouldn’t ask only students in band, or athletics. The best place to take this survey would be in the cafeteria, where ALL students congregate. This sample would be representative of the entire student population.
Practice Problem #11 Check Answer Julie is going to conduct a school survey for a research paper. Which sampling method is NOT a good representation of her school’s student population? A. Survey every fifth student as all students exit the main door at school B. Survey all students at a shopping mall C. Survey ¼ of all the students at school randomly D. Survey all the students whose names have been randomly drawn by the school’s computer
Practice Problem #12 Check Answer One Saturday Haley asked all the people leaving a jogging trail whether they run on a regular basis. Of the 378 people she asked, 347 said yes. Haley concluded that nearly all the people in her city run on a regular basis. What is the best explanation of why her conclusion might NOT be valid? A. The sample size was not large enough. B. Haley should have randomly selected people leaving the jogging trail. C. Haley did not ask how long each person ran. D. The sample may not have been representative of all the people in the city.
Misuses of Statistics The student evaluates predictions and conclusions based on statistical data. The student is expected to recognize misuses of graphical or numerical information. Misuses of Statistics Click and read about how statistics can be misleading or misused, causing people to draw the wrong conclusions.
Practice Problem #13 Check Answer The bar graph shows the average number of hours per week that students in different grades use computers. Which statement best explains why a person reading the graph might get an incorrect idea about the differences in the number of hours computers are used by students in the grades shown? A. The title of the graph is misleading. B. The grade intervals do not show how much time college students use computers. C. The vertical scale should show minutes of computer use instead of hours. D. The intervals on the vertical scale are not consistent.
Practice Problem #14 Check Answer The bar graph below shows the average number of minutes that students in grades Pre- K through 10 use the Internet in school per day. Which statement best explains why this graph is misleading? A. The horizontal scale intervals are not consistent. B. College students are not included in the graph. C. The title of the graph does not include the word “minutes.” D. The vertical scale intervals are not consistent.
Data Analysis The student evaluates predictions and conclusions based on statistical data. The student is expected to evaluate predictions and conclusions based on data analysis. Data analysis is simply, compiling, evaluating, and presenting numerical evidence to support and illustrate arguments. There are three tasks and skills involved in doing data analysis: finding, presenting, and interpreting numerical evidence.
Presenting the Data Good data presentation skills are to data-based analysis what good writing is to literature, and some of the same basic principles apply to both. More important, poor graphical and tabular presentations often lead both readers and writers to draw erroneous conclusions from their data and obscure facts that better presentations would reveal. Some of these practices involve deliberate distortions of data, but more commonly they involve either unintentional distortions or simply ineffective approaches to presenting numerical evidence.
Interpreting Data The ability to draw conclusions and make predictions based on graphical or numerical data is increasingly important in today’s society. When interpreting data, pay attention to detail! Make sure the data is well-identified and that the scales are consistent. There are a few more practice problems – all on interpreting data from graphs and charts. Do your best!
Practice Problem #15 Check Answer The table shows the results of a survey given to the 450 graduating seniors about their education plans after high school. Based on these data, which of the following statements is true? A. Only 15 students have no future educational plans. B. More students plan to attend a community college or technical school than plan to attend a university. C. Fewer than half of the students plan to attend university. D. Fewer than one-fourth of the students plan to attend a community college.
Practice Problem #16 Check Answer The table below shows the population and the area in square miles of some U.S. states. Which statement best describes the relationship between the population and the area of a state? A. The larger a state’s area, the larger its population is. B. No relationship can be determined from the data in the table. C. New Jersey has the smallest population of the states in the table because it has the smallest area. D. Texas is the largest U.S. state.
Practice Problem #17 Check Answer Mr. Vincent owns a store that sells auto parts. He budgeted $24,000 for the store’s expenses last month. The graph below shows the percentage of the budget he reserved for each type of expense. Which statement is best supported by the data in the graph? A. Mr. Vincent budgeted $15,500 for labor, utilities, and rent. B. More than 50% of Mr. Vincent’s budget was reserved for rent and utilities. C. Mr. Vincent budgeted $16,800 for labor, insurance, and inventory. D. Less than 50% of Mr. Vincent’s budget was reserved for labor and inventory.
Practice Problem #18 Check Answer End Show The graph below shows the results of a survey about the animal that people prefer as a pet. According to this graph, which statement is true? A. Twice as many people prefer dogs to fish. B. Most people do not prefer horses as pets because they are too big to care for. C. Many people prefer fish as pets because they are easy to care for. D. Five more people prefer cats to birds.
Answer to Problem #1 Back Correct answer: A A negative trend line will fall from left to right, as indicated in this graph.
Answer to Problem #2 Back Correct answer: D. As Betsy increased the number of minutes on the phone, the cost of the phone calls increased. The number of calls is irrelevant; the graph compares the number of minutes to the cost of each call.
Answer to Problem #3 Back Correct answer: D. No trend If the plot on the graph is scattered in such a way that it does not approximate a line (it does not appear to rise or fall), there is no correlation between the sets of data.
Answer to Problem #4 Back Correct answer: C. 540 75 out of 500 sandwiches sold were ham & cheese, which equals 15% A circle has 3600. Multiply 15% x 360 to find the degree measure of the central angle for that section.
Answer to Problem #5 Back Correct answer: C Each set of tally marks represents 5. Simply count the tally marks for each income range and match the totals to the bars in the histogram.
Answer to Problem #6 Back Correct answer: D Multiply 240 × percent of votes that each candidate received to determine the number of votes. Match at least 3 of the candidates.
Answer to Problem #7 Back Correct answer: B. X 20% of 360 = 720 720 is 1/5 of the circle. The only section that could be 720 is section X.
Answer to Problem #8 Back Correct answer: A A line plot consists of a horizontal number line, on which each value of a set is denoted by an x over the corresponding value on the number line. The number of x's above each score indicates how many times each score occurred.
Answer to Problem #9 Back Correct answer: D If 20 farmers grow corn, the sum of the numbers inside that circle should equal 20. On answer choice D, the sum of the numbers inside the corn circle equals 23. 15 + 2 + 3 + 3 = 23
Answer to Problem #10 Back Correct answer: D Gold = 20% of 200 = 40 Silver = 25% of 200 = 50 Black = 35% of 200 = 70 Red = 20% of 200 = 40
Answer to Problem #11 Back Correct answer: B. Survey all students at a shopping mall Not all students at the mall go to her school!
Answer to Problem #12 Back Correct answer: D. The sample may not have been representative of all the people in the city. Of course, most people on the jogging trail will say they run regularly; that doesn’t mean all people in the city will too!
Answer to Problem #13 Back Correct answer: D. The intervals on the vertical scale are not consistent. When creating any type of graph, the scales on both axes must be consistent!
Answer to Problem #14 Back Correct answer: D. The vertical scale intervals are not consistent.
Answer to Problem #15 Back Correct answer: C. Fewer than half of the students plan to attend university; ½ = 50% & 44% < 50% Not A; 15% are undecided – not 15 students Not B; 26 + 15 = 41%; 41% < 46% Not D; ¼ = 25%; 26% > 25%
Answer to Problem #16 Back Correct answer: B. No relationship can be determined from the data in the table. A scatterplot of the data shows no correlation between area of a state & its population.
Answer to Problem #17 Back Correct Answer: C. Mr. Vincent budgeted $16,800 for labor, insurance, and inventory 36 + 12 + 22 = 70 70% of 24,000 = 16,800
Answer to Problem #18 Back Correct answer: D. Five more people prefer cats to birds. 35 – 30 = 5