Unlocking IEA Data with Beyond 20/20 Energy Statistics Training in Paris
Join us for the Beyond 20/20 Energy Statistics Training in Paris from March 4-8, 2013. This comprehensive program will guide participants through the International Energy Agency's (IEA) data access and analytical capabilities using the Beyond 20/20 software. Attendees will learn to navigate multi-dimensional datasets, create charts, export data to Excel, and practical exercises on hiding elements, sorting data, and generating visual representations like pie charts. Perfect for anyone working with energy statistics and data analysis.

Unlocking IEA Data with Beyond 20/20 Energy Statistics Training in Paris
E N D
Presentation Transcript
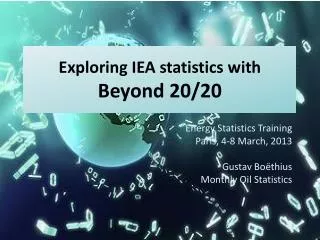
Exploring IEA statistics with Beyond 20/20 Energy Statistics Training Paris, 4-8 March, 2013 Gustav Boëthius Monthly Oil Statistics
Presentation overview • What is Beyond 20/20? • Accessing IEA data with B20/20 • Data layout in B20/20 • Nesting dimensions, viewing notes • Examples of other B20/20 features • Charts, time series, sorting data, exporting data • Further information and practical exercises
What is Beyond20/20? • A programme toaccess and view statistical data • Easy to display multi-dimensional datasets • File extension: .ivt - IEA publishes energy data in this format
Accessing IEA data with B20/20 Annual, quarterly services and monthly gas http://wds.iea.org
Accessing IEA data with B20/20 http://mods.iea.org/ Monthly Oil Data Service
Accessing IEA data with B20/20 1 2 Download .ivtfile
Data layout in B20/20 Dimensions Active dimension Elements in the active dimension
Examples of other B20/20 features Charts Time series Export to Excel Frequency
Other features:Displaying data on a chart Hurricane Gustav Hurricane Katrina Insert chart Select data and then View > Chart or click on
Other features:A range of chart options Change chart type Right click > Chart options Format chart Double click on the element Copy a chart Right click > Copy
Other features:Time series options – set frequency For closing stock levels Remember to choose “Last Values”
26 September 2012 Other features:Sorting data To sort data 1. Select a dimension 2. Click on 3. Remember to choose “Data” as a field 4. Choose increasing or decreasing
Other features:Exporting data to Excel • Select data, copy and paste it to Excel • File > Save as .xls
Further information • B20/20 Manual Next: Practical exercises B2020.1 - Hiding elements and displaying chart B2020.2 - Sorting data B2020.3 - Exporting to Excel B2020.4 - Pie chart