Download
1 / 76
760 likes | 905 Vues
Primer on Statistics for Interventional Cardiologists Giuseppe Sangiorgi, MD Pierfrancesco Agostoni, MD Giuseppe Biondi-Zoccai, MD. What you will learn. Introduction Basics Descriptive statistics Probability distributions Inferential statistics

E N D
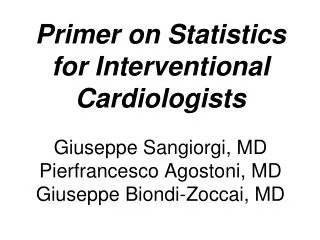
Primer on Statistics for Interventional CardiologistsGiuseppe Sangiorgi, MDPierfrancesco Agostoni, MDGiuseppe Biondi-Zoccai, MD
What you will learn Introduction Basics Descriptive statistics Probability distributions Inferential statistics Finding differences in mean between two groups Finding differences in mean between more than 2 groups Linear regression and correlation for bivariate analysis Analysis of categorical data (contingency tables) Analysis of time-to-event data (survival analysis) Advanced statistics at a glance Conclusions and take home messages
What you will learn Introduction Basics Descriptive statistics Probability distributions Inferential statistics Finding differences in mean between two groups Finding differences in mean between more than 2 groups Linear regression and correlation for bivariate analysis Analysis of categorical data (contingency tables) Analysis of time-to-event data (survival analysis) Advanced statistics at a glance Conclusions and take home messages
What you will learn • Descriptive statistics • frequency distributions • contingency tables • measures of location: mean, median, mode • measures of dispersion: variance, standard deviation, range, interquartile range • coefficient of variation • graphical presentation: histogram, box-plot, scatter plot • correlation
What you will learn • Descriptive statistics • frequency distributions • contingency tables • measures of location: mean, median, mode • measures of dispersion: variance, standard deviation, range, interquartile range • coefficient of variation • graphical presentation: histogram, box-plot, scatter plot • correlation
Counting and displaying data After we have collected our data, we need to display them (tables, graphics and figures) Raw enumeration(eg lesion length by visual estimation in patients treated in Endeavor II trial: 14-27 mm) …
Tabular display example
Tabular display example DELAYED RRISC, JACC 2007
Tabular display example DELAYED RRISC, JACC 2007
Types of variables Variables CATEGORY QUANTITY nominal ordinal discrete continuous measuring ordered categories counting ranks
Counting and displaying data Create a database!
Frequency distribution A frequency distribution is a list of the values that a variable takes in a sample. It is usually a list, ordered by quantity, showing the number of times each value appears
Frequency distribution A frequency distribution is a list of the values that a variable takes in a sample. It is usually a list, ordered by quantity, showing the number of times each value appears This introduces the concept of percentage or rate
Frequency distribution ENDEAVOR III, JACC 2006
Frequency distribution This simple tabulation has drawbacks. When a variable can take continuous values instead of discrete values or when the number of possible values is too large, the table construction is cumbersome, if not impossible
Frequency distribution A slightly different tabulation scheme based on the range of values can be a solution in such cases However better solutions are coming later…
What you will learn • Descriptive statistics • frequency distributions • contingency tables • measures of location: mean, median, mode • measures of dispersion: variance, standard deviation, range, interquartile range • coefficient of variation • graphical presentation: histogram, box-plot, scatter plot • correlation
Counting and displaying data Contingency tables are used to record and analyse the relationship between two (or more) variables, most usually categorical variables
AHA/ACC type A B1 B2 C Total DIABETES no 3 3 0 2 8 yes 1 0 3 1 5 Total 4 3 3 3 13 Counting and displaying data Contingency tables are used to record and analyse the relationship between two (or more) variables, most usually categorical variables
AHA/ACC type A B1 B2 C Total no Count 3 3 0 2 8 % within DIABETES 37,5% 37,5% ,0% 25,0% 100,0% DIABETES yes Count 1 0 3 1 5 % within DIABETES 20,0% ,0% 60,0% 20,0% 100,0% Total Count 4 3 3 3 13 % within DIABETES 30,8% 23,1% 23,1% 23,1% 100,0% Counting and displaying data Contingency tables are used to record and analyse the relationship between two (or more) variables, most usually categorical variables Is there a difference between diabetics and non-dabetics in the rate of AHA/ACC type lesions? The answer will follow…
What you will learn • Descriptive statistics • frequency distributions • contingency tables • measures of location: mean, median, mode • measures of dispersion: variance, standard deviation, range, interquartile range • coefficient of variation • graphical presentation: histogram, box-plot, scatter plot • correlation
Measures of central tendency: rationale We need to describe the kind of values that we have (eg lesion length by visual estimation in patients treated in Endeavor II trial: 14-27 mm) Raw enumeration …
Mean (arithmetic) • Characteristics: • -summarises information well • -discards a lot of information(dispersion??) • Assumptions: • -data are not skewed • distorts the mean • outliers make the mean very different • -Measured on measurement scale • cannot find mean of a categorical measure • ‘average’ stent diameter may be meaningless
Mean (arithmetic) 14+15+16+17+18+18+19+21+22+23+24+25+27 13 Mean = 19.92
Mean (arithmetic) TAPAS, Lancet 2008
Median • What is it? • The one in the middle • Place values in order • Median is central • Definition: • Equally distant from all other values • Used for: • Ordinal data • Skewed data / outliers
Mode • What is it? • Definition: • The most common value • Used (rarely) for: • Discrete non interval data • E.g. stent length, stent diameter………… • MicroDriver is only available in 2.25, 2.50, 2.75 reporting the mean is meaningless
Comparing Measures of central tendency • Mean is usually best • If it works • Useful properties (with standard deviation [SD]) • But… Driver Endeavor 17 21 19 21 Lesion length 19 21 17 21 18 6 Mean 18 18 Median 18 21
Comparing Measures of central tendency It also depends on the underlying distribution… Symmetric? mean = median = mode Frequency Value
Comparing Measures of central tendency It also depends on the underlying distribution… Asymmetric? mean ≠ median ≠ mode 30 Mode Median 25 Mean 20 Frequency 15 10 5 0 0 1 2 3 4 5 6 7 8 9 Number of Endeavor implanted per patient
Median Agostoni et al, AJC 2007
What you will learn • Descriptive statistics • frequency distributions • contingency tables • measures of location: mean, median, mode • measures of dispersion: variance, standard deviation, range, interquartile range • coefficient of variation • graphical presentation: histogram, box-plot, scatter plot • correlation
Measures of dispersion: rationale • Central tendency doesn’t tell us everything • We need to know about the spread, or dispersion of the scores • Is there a difference? And if yes, how big is it? • We can only tell if we know data dispersion Late loss(mm) Group Endeavor 0.61 Driver 1.03 ENDEAVOR II, Circulation 2006
Measures of dispersion: examples Frequency 0 0.30 0.60 0.90 1.20 1.50 Late loss Endeavor Driver
Measures of dispersion: examples Frequency 0 0.30 0.60 0.90 1.20 1.50 Late loss Endeavor Driver
Measures of dispersion: examples Frequency 0 0.30 0.60 0.90 1.20 1.50 Late loss Endeavor Driver
Shape of distribution Gaussian, normal or “parametric” distribution
Departing from normality Non-normal, right-skewed
Departing from normality Frequency Value Non-normal, left-skewed
Departing from normality 20 Outliers 10 Frequency 0 Value
Measures of dispersion: types • Standard deviation (SD) • Used with mean • Parametric tests • Range • First to last value • Not commonly used • Interquartile range • Used with median • 25% (1/4) to 75% (3/4) percentile • Non-parametric tests
- 2 ( x x ) S = SD - N 1 Standard deviation • Standard deviation (SD): • approximates population σ • as N increases • Advantages: • with mean enables powerful synthesis • mean±1*SD 68% of data • mean±2*SD 95% of data (1.96) • mean±3*SD 99% of data (2.86) • Disadvantages: • is based on normal assumptions Variance
Standard deviation - 2 ( x x ) S = SD - N 1 (18-19.92)2+(24-19.92)2+(17-19.92)2+…+(27-19.92)2 12 Variance = 16.58 SD = √16.58 = 4.07
Mean ± Standard deviation 68% Frequency mean -1 SD +1 SD
Mean ± Standard deviation 95% Frequency mean -2 SD -1 SD +1 SD +2 SD
Mean ± Standard deviation 99% Frequency mean -3 SD -2 SD -1 SD +1 SD +2 SD +3 SD
Standard deviation TAPAS, Lancet 2008